Hierarchy Explorer
Summary view
A summary view is added to the Hierarchy Explorer widget. It displays an HCO's hierarchy in a tree view so you can review the entire hierarchy on a single page.
This view can be helpful for understand the different levels of the hierarchy, for preparing for custom hierarchies, and for understanding target counts. You can also use the screenshot tool to snap a picture of the hierarchy so you can share it and use it for presentations.
The Summary View is enabled by default in the Hierarchy Explorer.
Access the summary view
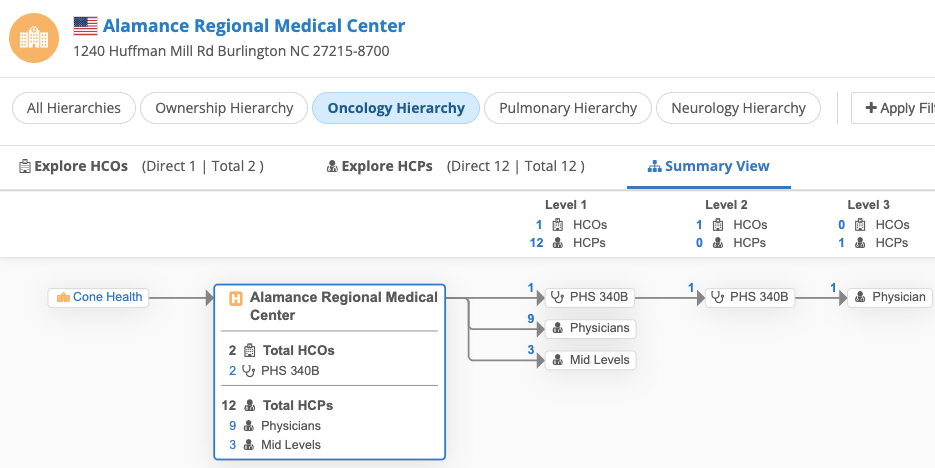
Open an HCO and click Summary View. The view is supported for the default, All Hierarchies view, or you can review the HCO in the context of any custom hierarchy.
![]()
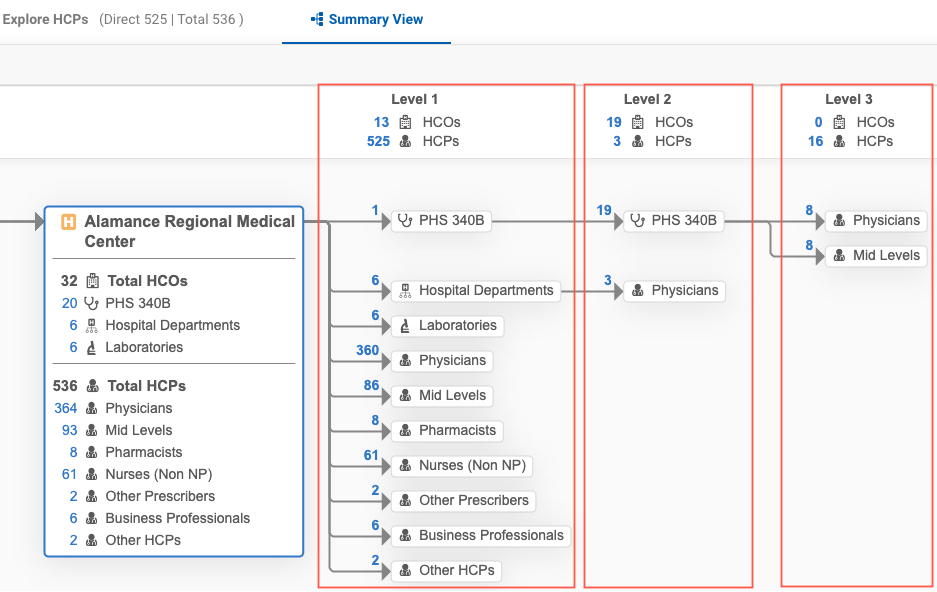
When the summary view opens, all levels of hierarchy for the root HCO display in a tree view.
Tools
The following tools are available to help you to customize and navigate the Summary View canvas:
-
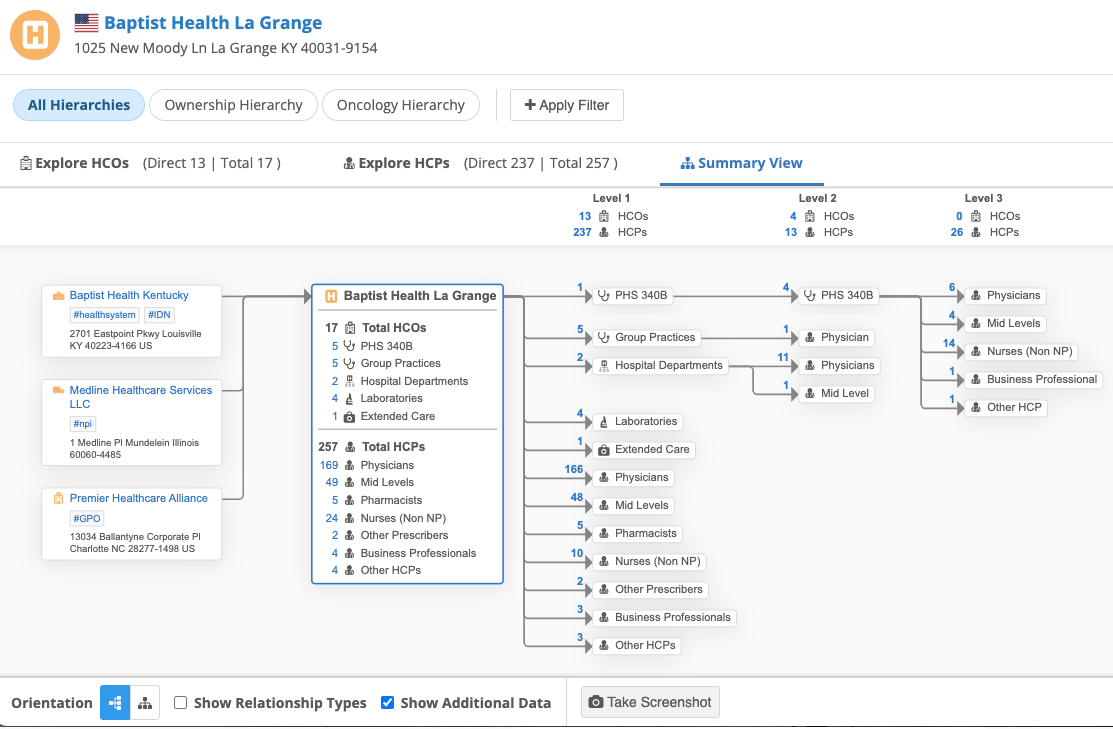
Orientation - By default, the summary view displays as a vertical
 tree view. Use the Orientation icons to toggle the summary view from a vertical tree view to a horizontal tree
  view.
view. -
Show Relationship Types - Highlight relationship types on the graph (supported for US data only).
-
Pan and zoom - Use the zoom tool to increase or decrease the size of the graph. To pan, drag the canvas with your mouse cursor.
-
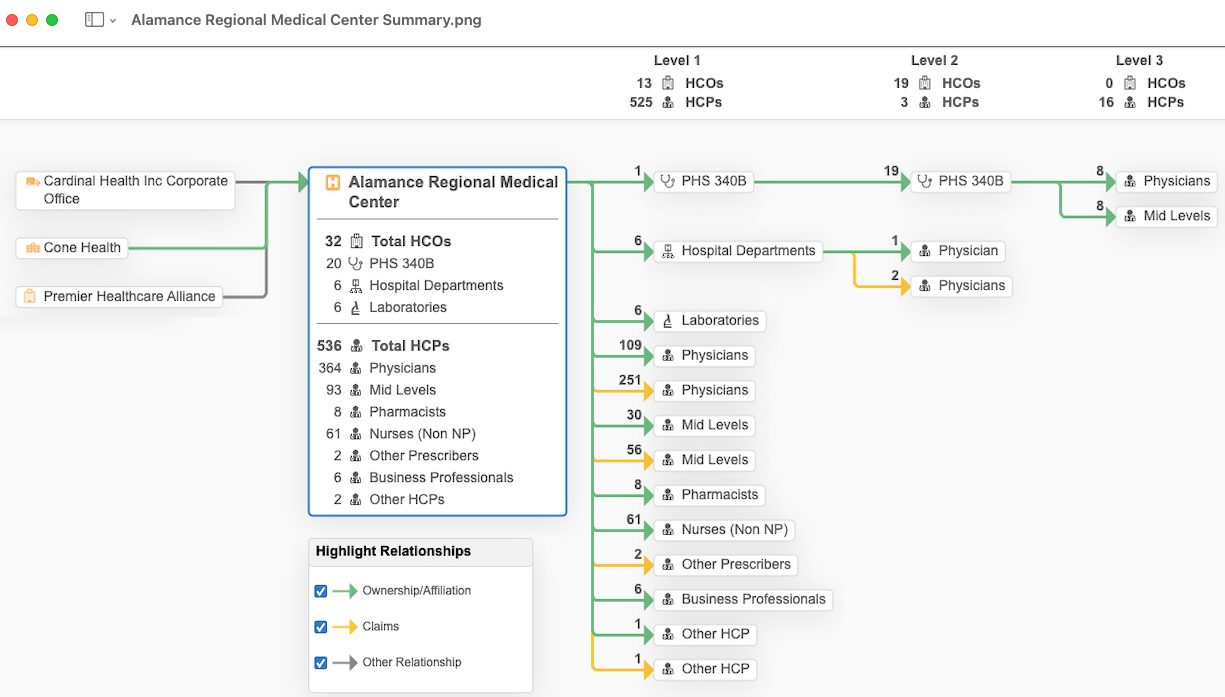
Take Screenshot - Click this button to take a screenshot of the graph. A .png file is saved to your local computer with the following file naming convention: <Root HCO name> Summary.png.
When the screenshot is taken, it considers the following:
-
Orientation - The screenshot will display the graph in the current orientation.
-
Active filters - Records that match the filters are highlighted in blue.
-
Relationship types - When relationships types are filtered out, those relationships will be dimmed.
Example screenshot
-
Hierarchy counts
The box containing the root HCO displays the total count of HCOs and HCPs in the HCO''s hierarchy. Below the total count is a breakdown count for each HCP and HCO type.
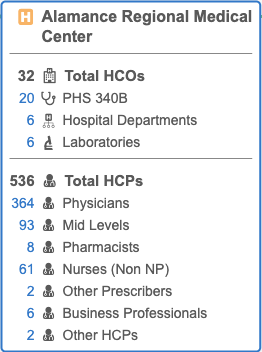
If the summary view is using a custom hierarchy, the counts reflect only the records that apply to the custom hierarchy.
HCP and HCO groupings
HCPs and HCOs are grouped so it is easy to understand the types of HCPs and HCOs in the hierarchy. Not all HCO and HCP types are listed. The types are categorized into specific groups.
|
HCO Groupings
|
HCP Groupings
|
The groups are mapped to specific HCO/HCP types. The HCP group mappings also consider the Medical Degree field and can be country-specific.
The HCO and HCP group mappings are available in the Summary View topic.
Level counts
A summary of the HCO's hierarchy levels display on the top bar (or the sidebar if the orientation is set to the horizontal tree view).
Each level provides counts for the HCPs and HCOs in the root HCO's hierarchy. The counts are aligned to the HCP and HCO group counts in the graph and reflect any active filters or custom hierarchy that is applied to the hierarchy.
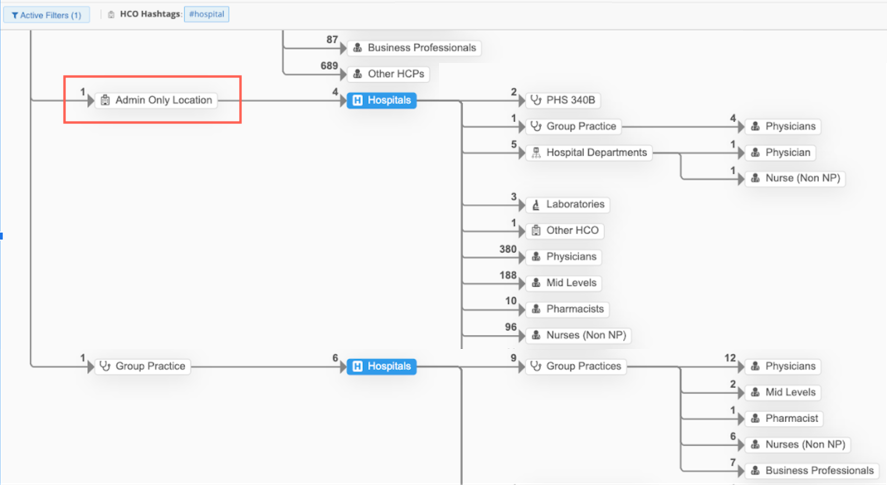
Include subsidiary HCOs
Only records that meet any applied filters and custom hierarchy display in the summary view and are considered in the count. However, subsidiary HCOs (HCOs that are between the root HCO and the filtered HCOs) are contained in the count.
Example
Filter a hierarchy using the #hospital hashtag. Hospitals are highlighted.
In this case, there is an Admin Only Location that is a parent of the hospital. The Admin Only Location is a subsidiary HCO, but it is counted to ensure you can view the entire path of the hierarchy in the summary view.
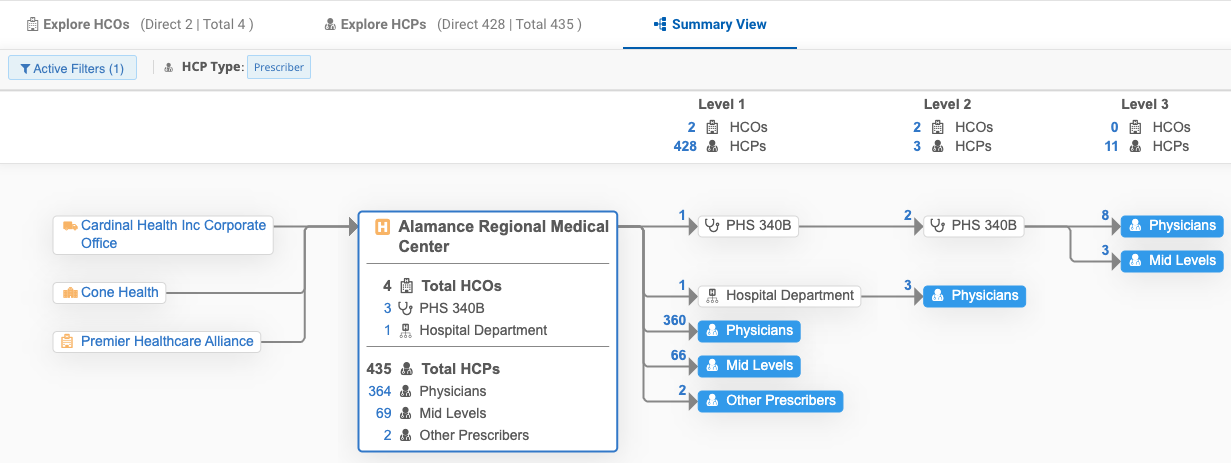
Filter the graph
You can apply filters to HCOs and HCPs so you can view relevant records in the hierarchy. When filters are applied, the graph refreshes and records that match the filters are highlighted in blue. Records that do not match the filter are removed. The counts also update to reflect the filtered records.
Show relationship types
Use the Show Relationship Types option to view the relationship details for the hierarchy.
Note: This is supported for US data only.
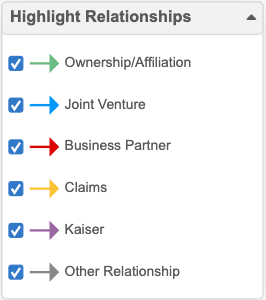
When the option is applied, the connecting lines on the graph are highlighted to identify the relationship types. A legend, Highlight Relationships, displays to map the line color to the relationship type.
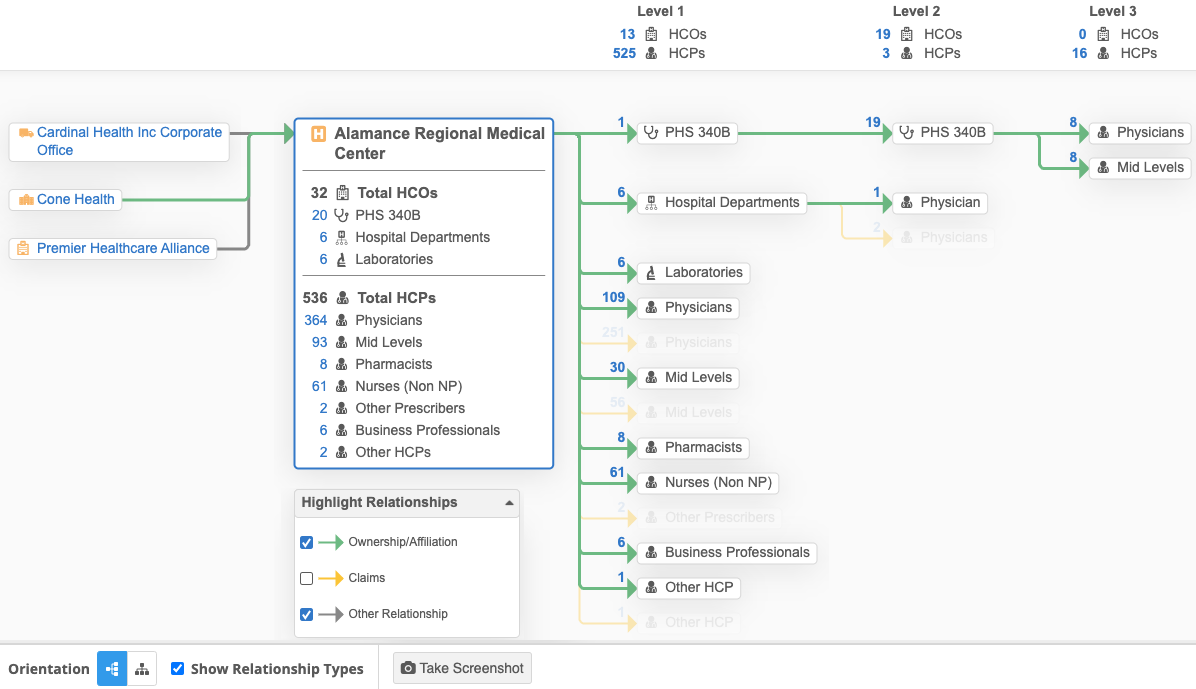
By default, all of the applicable relationship types display.
To focus on specific relationship types, clear the checkbox beside relationship types that you do not need to view. This will dim the related records and connecting lines on the graph.
Supported relationship types
|
|
Toggle between custom hierarchies
You can toggle between any of the custom hierarchies available to understand the structure of the custom hierarchy. When you change the hierarchy, the graph updates to display only the accounts that are part of the custom hierarchy.