Using the Affiliation widget
DM
DS
ST
Network's Affiliation widget displays an Influence Map of the professionals and organizations in a health system so you can quickly understand the key players and influencers.
For example, sales representatives, home office leaders, and key account managers can use the Influence Map to understand the main influencers at a health system so they know who to target in a product's pre-commercial stage.
You can view affiliations on the Influence Map to quickly visualize metrics like disease expertise and product familiarity, or you can view the health care professional (HCP) data in a table to understand how HCPs are affiliated and influence each other. Open individual profiles to explore more information or to edit details.
To customize the health system, you can add and remove accounts and relationships. You can also create different views so you can customize an Influence Map without limiting other users.
Access to the widget
If you have an active Network user account, you can sign into the widget using SSO authentication.
When you first access the widget, you might see a warning to disable the popup blocker in your web browser.
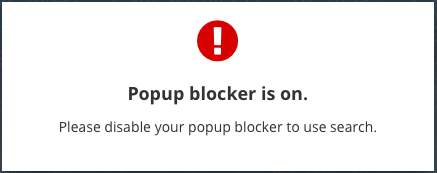
After the popup blocker is disabled and you are logging in, the widget is prepared and loaded, pending successful authentication.
Using the Influence Map
The Affiliation widget displays data that exists in your Network instance; it does not display data that is in Veeva OpenData. Records are restricted to your data visibility profile permissions.
Directory view
When you open the Affiliation widget for the first time, the List View tab displays by default. This displays a directory of all HCOs that have been defined as health systems in your Network instance.
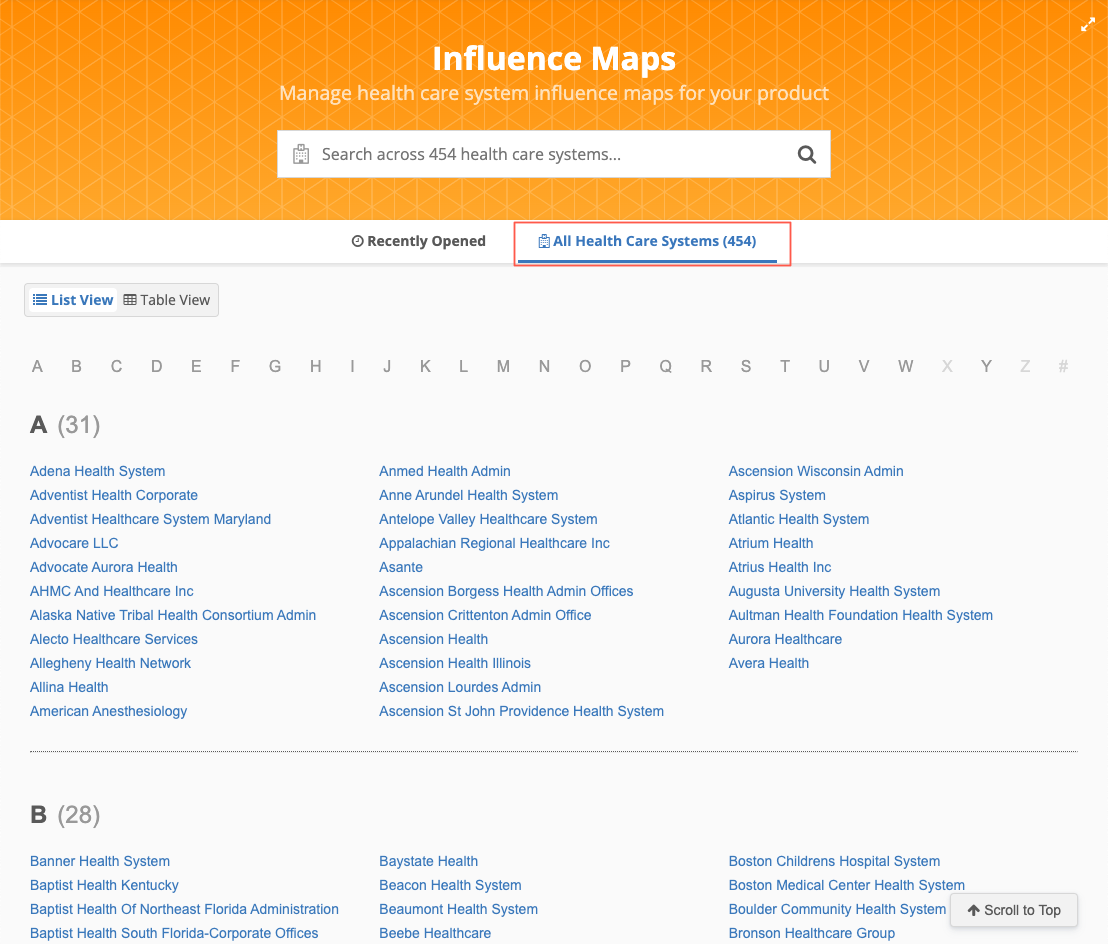
Health system names that do not begin with a letter (A-Z), display when you click the # symbol.
Smaller directories
If there are fewer than 2000 health systems in your Network instance, the HCOs display in alphabetical order on a single page. You can quickly scroll through the list or select a letter in the header to move to that section on the page.
Business cards
Hover over a health system to see to display a pop-up containing the following details:
-
corporate name
-
address
-
HCO type
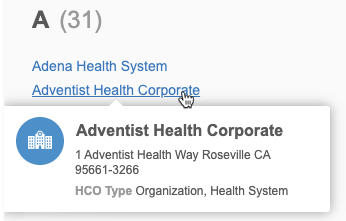
Table view
Use the table view to see the directory of health systems with additional details.
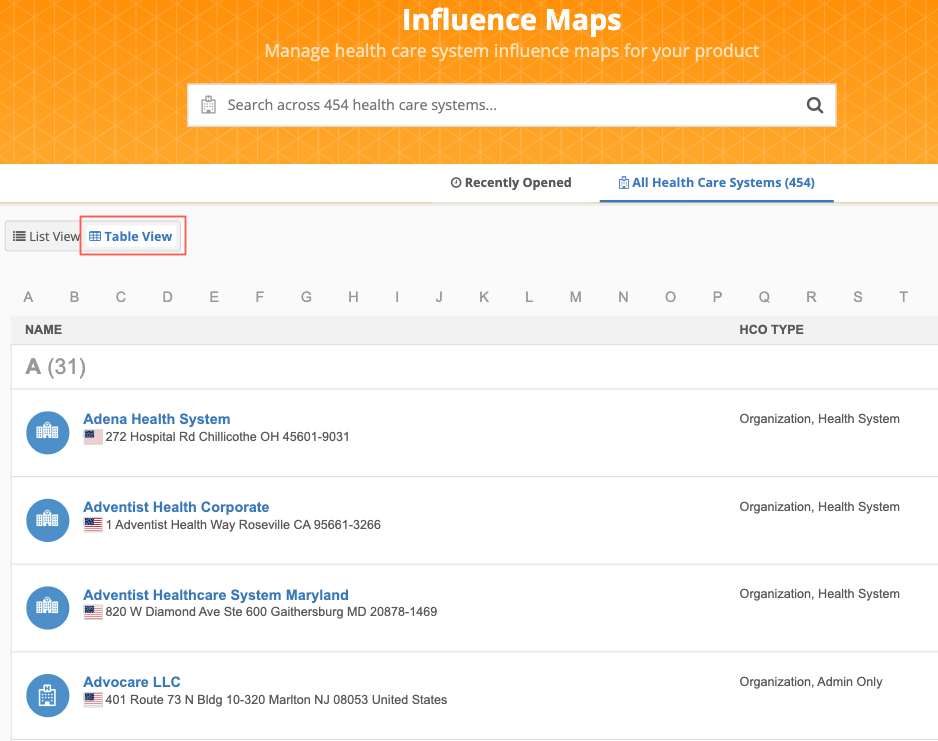
The health systems are organized in alphabetical order. Click the letters in the header to find an HCO by its corporate name.
Details
By default, the following details display for each health system:
-
corporate name
-
HCO type
-
address
-
Network ID
Smaller directories
If there are fewer than 2000 health systems in your Network instance, the HCOs display in alphabetical order on a single page. Scroll through the page to find the health system by their corporate name or click a letter in the header to scroll to that section on the page.
Note: As you scroll through the directory of health systems on the List View or the Table View, the Affiliation widget banner hides so you can see only the directory header and the list of health systems. This provides more space to see the list of health systems.
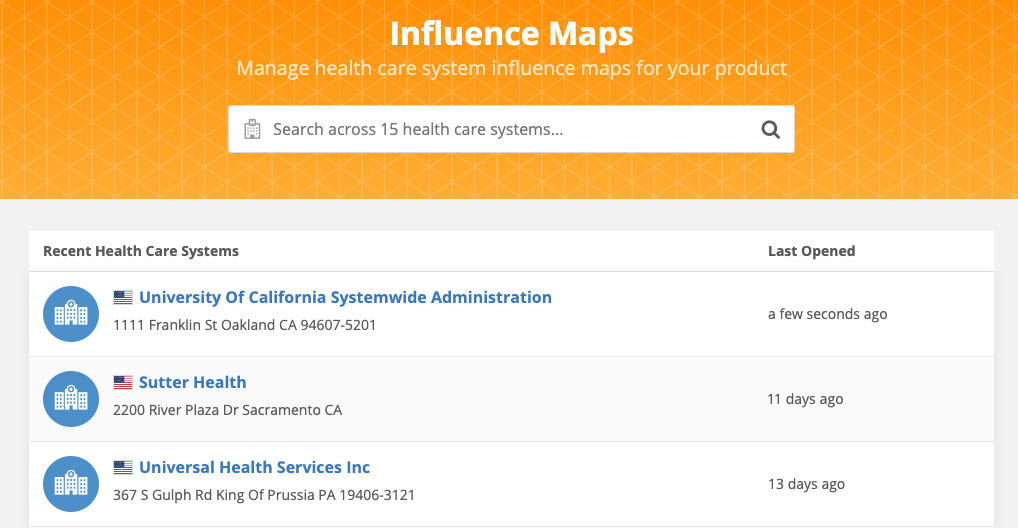
Recently Opened view
When you access the Affiliation widget after your first use, the health systems that you have recently viewed display on the page by default. Search for a health system or choose one of the recent systems.
Filter health system data
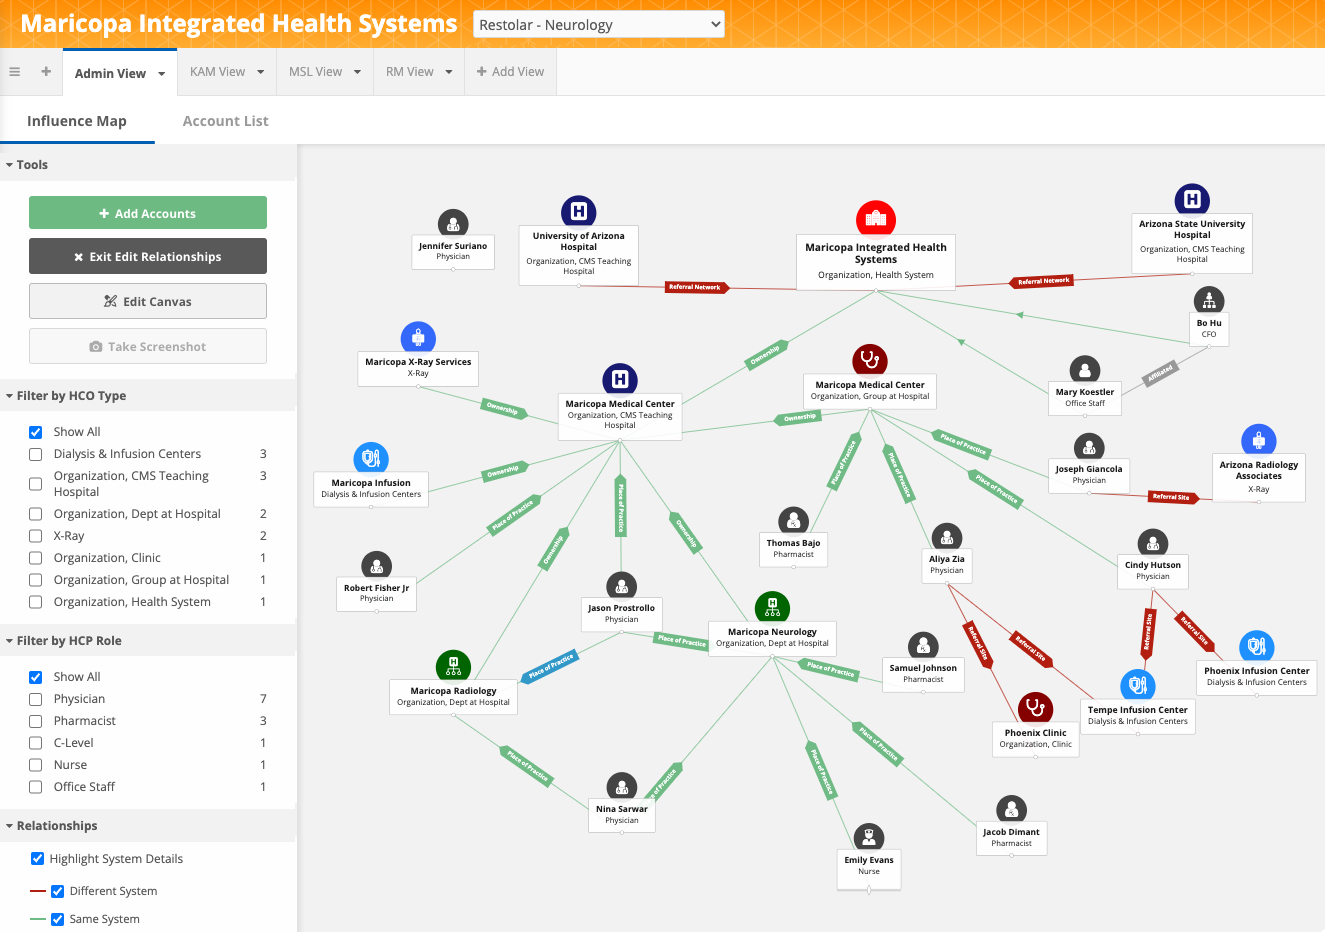
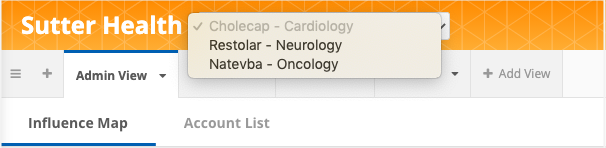
The widget opens to the Influence Map's default view. The HCPs and HCOs that display on the canvas relate to the default option selected in the Product filter.
Product filter
The Product filter options contain a product and therapeutic area combination; for example, you might see products for Diabetes, Parkinson's Disease, or Cardiology.
If you select another option from the list, the data reloads to display the new targets on the canvas. Your selection is saved for the next time you log into the widget.
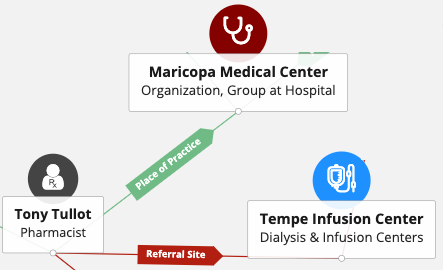
The lines show the connections between the entities in the health system. The following connections are supported:
- HCPs - HCOs
- HCOs - HCOs
- HCPs - HCPs
About the default view
The Influence Map contains a default Admin view. You can create views for specific business purposes or for your own use. All users with access to the health system can access all of the views if they have the same data visibility profile. Changes that you make on the views are displayed to other users. For example, if you add accounts or relationships, reposition accounts on the map, or remove an HCP, other users also see those changes on that view.
For more information, see Using views.
Veeva CRM considerations
The Affiliation widget does not indicate if accounts are inside or outside of Veeva CRM. Territories and alignment are not relevant to the data that displays and removing an HCP or HCO does not impact territory. Similarly, product metrics in CRM are not used for the widget.
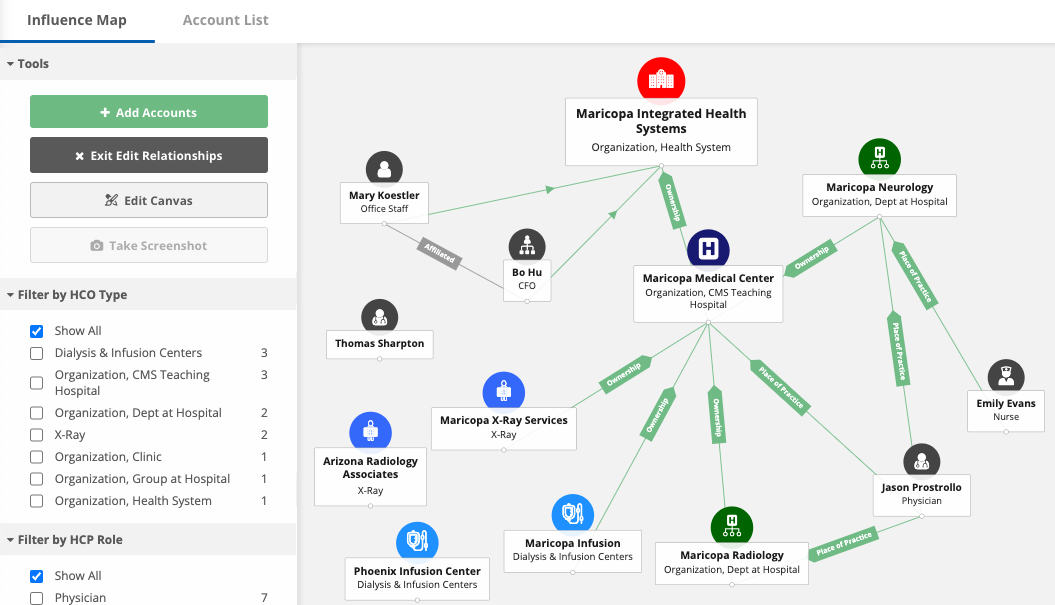
Tools pane
The Tools pane contains the options for personalizing the view; for example, by adding or editing accounts and by displaying metrics and ratings.
-
Add Accounts - Use the Search widget to find accounts to add to the Influence Map. You can also create an account if the account doesn't exist. For more information, see Add accounts.
-
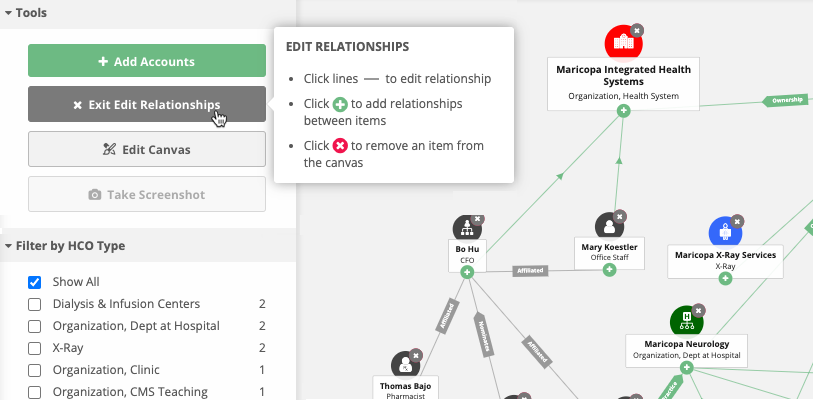
Edit Relationships - Click to create relationships (draw lines between accounts), remove individual accounts, and edit existing relationships. The Add and Remove icons display on each account when Edit Relationships is activated. Click Exit Edit Relationships when your changes are complete.
-
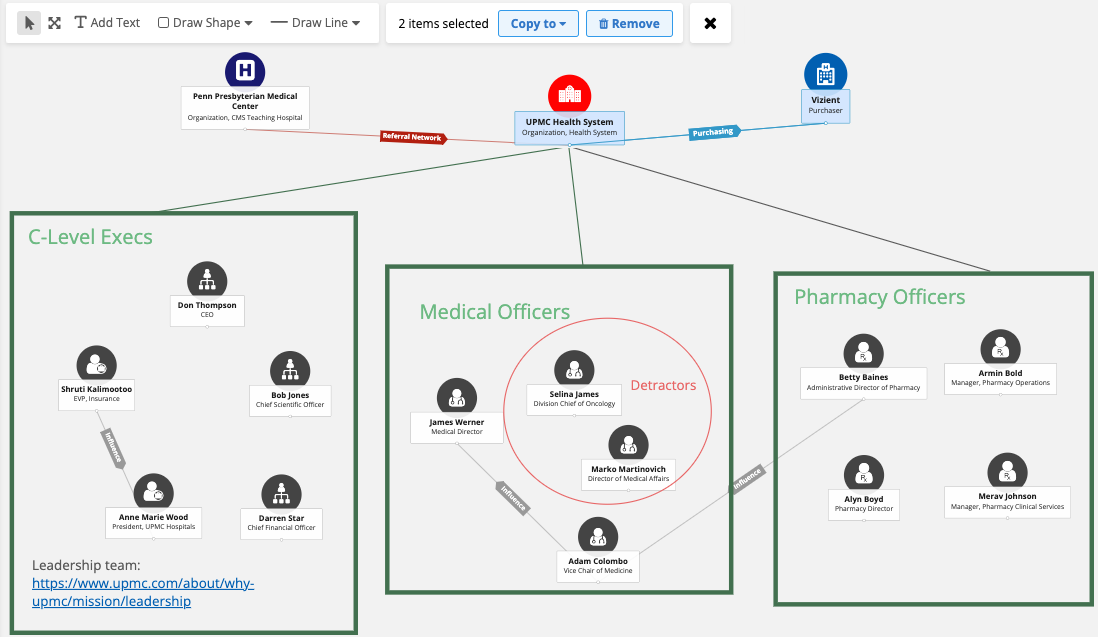
Edit Canvas - Add comments, links, arrows, and other graphical elements to emphasize specific aspects of the health system, drawing attention to notable records and areas of interest.
For details, see Annotating the influence map.
When the canvas is in Edit mode, you can select many HCP and HCO accounts to manage at the same time. For example, you can select several accounts to reposition them, to remove them, or to copy them to a new view or an existing view. For more information, see Bulk editing.
-
Take Screenshot- Snap a high quality image of the Influence Map.
The image will be downloaded to your local computer as a .png file with the following naming convention: <health_system> - <view_name>.png.
For more details, see Influence Map screenshots.
You can hide the Tools pane to create more space for the Influence map. By default, the Tools pane displays. When the pane is hidden, only the Add Accounts, Edit Mode, and Select Multiple options display. To display the pane again, expand it from the bottom corner.
You can also collapse the sections in the pane.
Select metrics
Metrics are listed in the Show Metrics box. Use the metrics with the Product filter to highlight relevant targets within the health system.
Select a rating level (Very High, High, Low, and so on) to highlight HCPs and HCOs with that rating level. When you select a metric, HCP and HCO icons change color and size to reflect their rating for that metric. Use the legend in the Filter by Rating box to understand the colors associated to the ratings.
Examples
- A sales rep might select a metric called Influence to find the HCPs that are rated High or Very High. These are the HCPs the sales rep will target in a pre-commercial stage.
- A marketing professional might find conference speakers using a Disease Expertise metric to find the targets rated High or Very High.
The available metrics are specific to your Affiliation widget configuration.
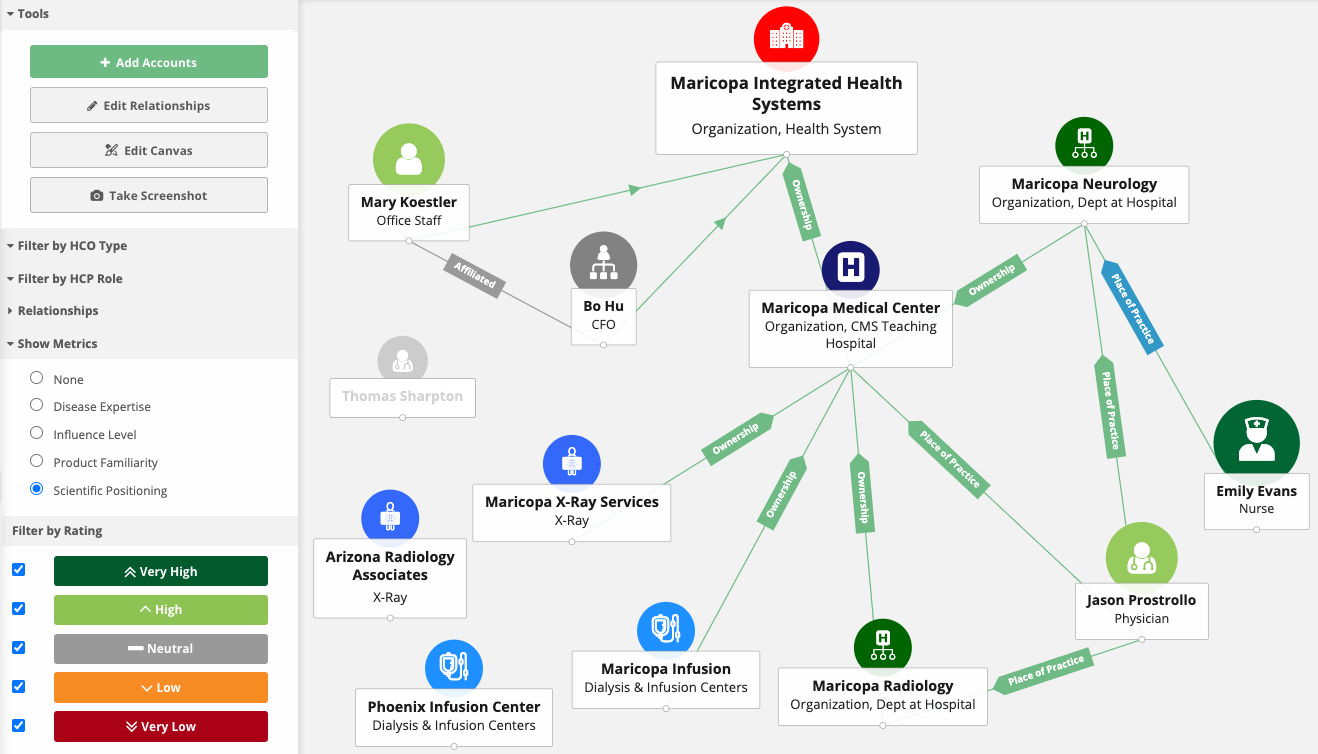
Note: If custom branding is applied, HCO icon colors do not update with the filtered metric. Open the HCO profile to view the individual ratings.
Filter by HCP/HCO type
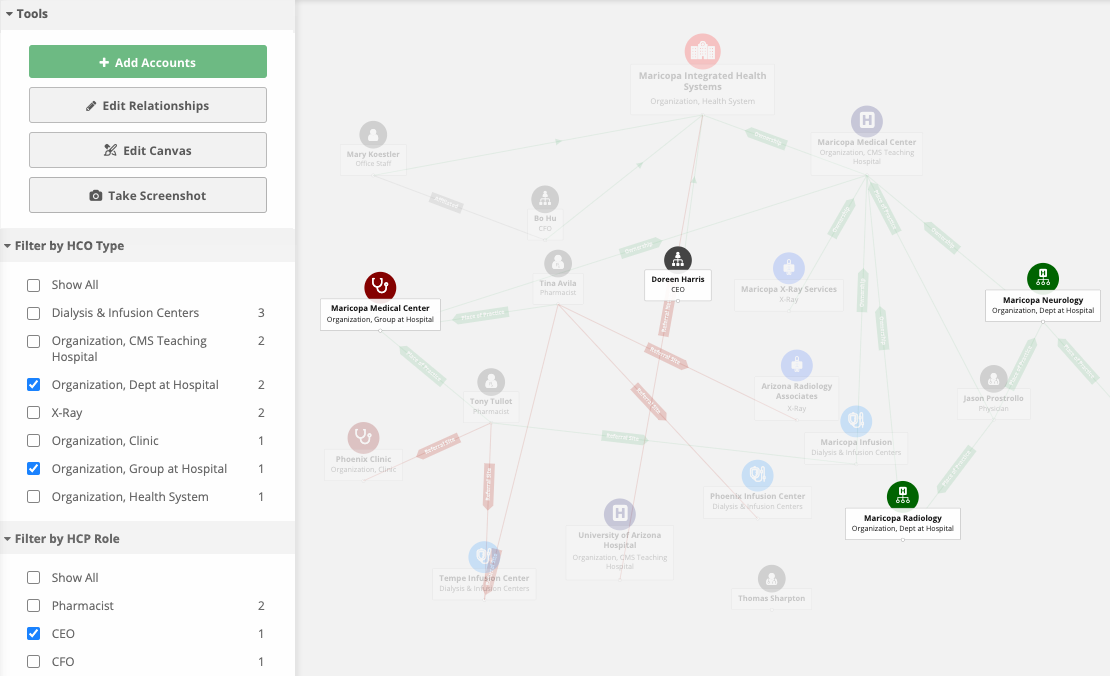
You can use filters to highlight specific HCPs and HCOs on the Influence Map. When filters are selected, records and relationships that are filtered out are dimmed so you can easily see which accounts apply to your selections.
Tip: Use the Filter section in the Tools menu as a quick overview of your health system. For example, use filters to easily see the number of Clinics or Infusion Centers in the health system.
Filter types
Filters are based on the customized branding field used for the entity icon and color. If administrators have not defined custom branding for the entity, then the entity layout field from the Affiliation widget configuration is used.
The Entity Layout field for HCPs is Role, so HCP filtering is based on role. Similarly, HCOs are labeled by Type, so HCO filtering is based on type.
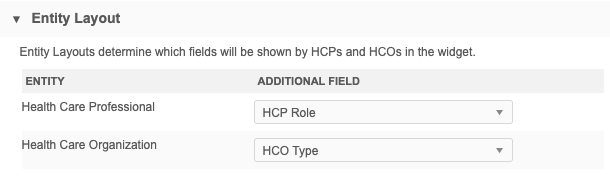
These fields map to the HCO/HCP filtering options available in the Influence Map.
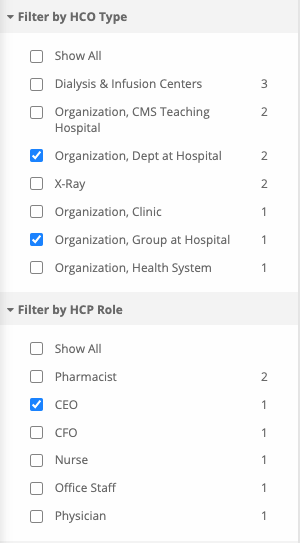
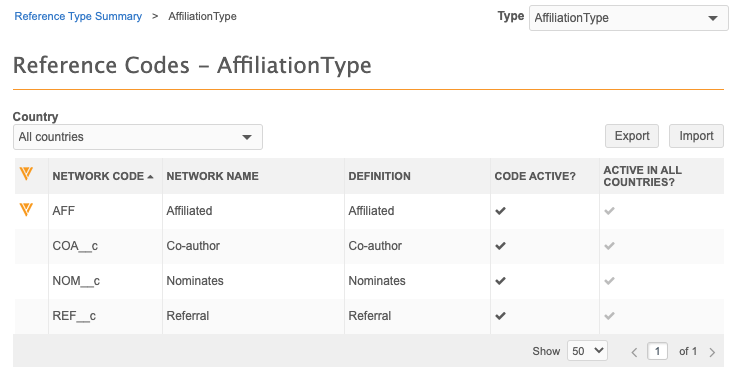
The reference values for the field display based on the health system's country. For example, if the health system is in the United States, only US reference values display. A count beside each reference value represents the number of HCPs and HCOs labeled with that value on the Influence Map.
The reference value list is sorted by count and then alphabetically. If there are more than 10 values in the list, click Show More to view additional values.
Note: If the entity layout field is a text field, the filter sections do not display in the Tools menu.
Display relationship info
You can choose how to display relationship information on the Influence Map. Relationships labels can be useful for understanding how objects are related, but for some users, the connecting lines are sufficient. Using the Tools menu, you can decide how the information is presented.
Viewing relationship labels
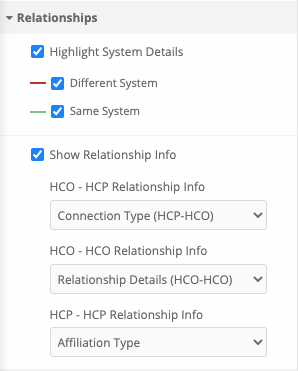
The Tools menu includes a Relationships section. The Show Relationship Info setting is enabled by default.
Note: If all relationships (HCP-HCO, HCP-HCP, HCO-HCO) have only one label each, only the Show Relationship Info setting displays.
For each relationship, you can define how you want to see the relationships identified on the Influence Map.
Example - HCO-HCP relationships
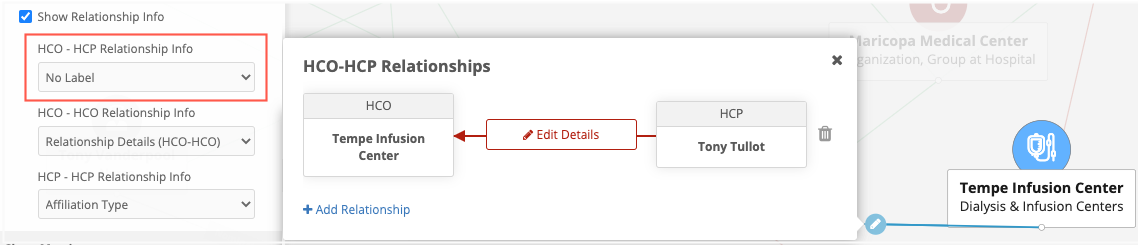
Expand the HCO-HCP Relationship Info list, to choose one of these options:
-
No label - Display only the connecting line between related objects only.
-
Arrow Only - Display an arrow on the connecting line to identify the direction of the relationship.
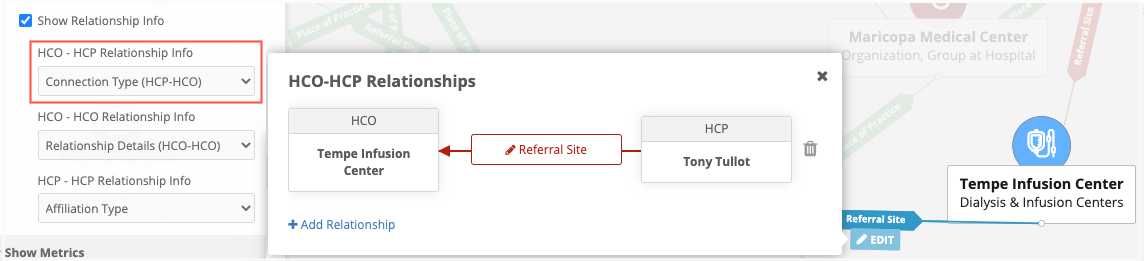
-
Connection Type - Display a label that describes the type of relationship between the HCO-HCP.
This option is mapped to the custom field that you have defined for the Parent HCO object for these relationships. To add custom fields for relationship labels, contact Veeva Support.
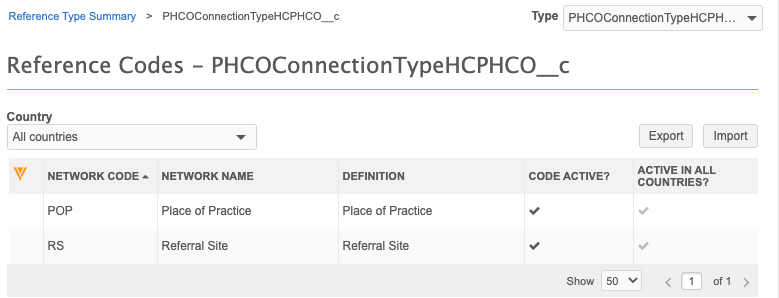
When Connection Type is selected, the relationship label displays the reference value.
Similarly, the HCO-HCO relationship will have these options with the custom field that is created for those relationships. The HCP-HCP Relationship Info list always contains the Affiliation Type field. When you edit the relationship details on the Influence Map, you can update the label with the type of affiliation based on the reference values for the field.
Editing relationships
When you edit a relationship (click on the connecting line between the two objects), the pop-up displays the relationship label. If you have chosen No Label or Arrow Only for the relationship info in the Tools menu, the Edit Details label displays between the two objects.
If you chose to display the label, the pop-up displays the current label for the relationship.
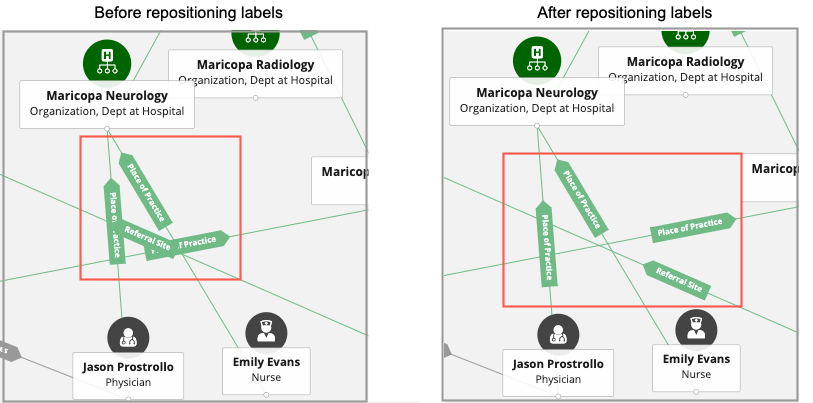
Reposition relationship labels
Move the relationship labels on the connecting lines between two entities to avoid overlapping when Influence Maps are large.
To move the label, hover your cursor over the label and drag it to a different position.
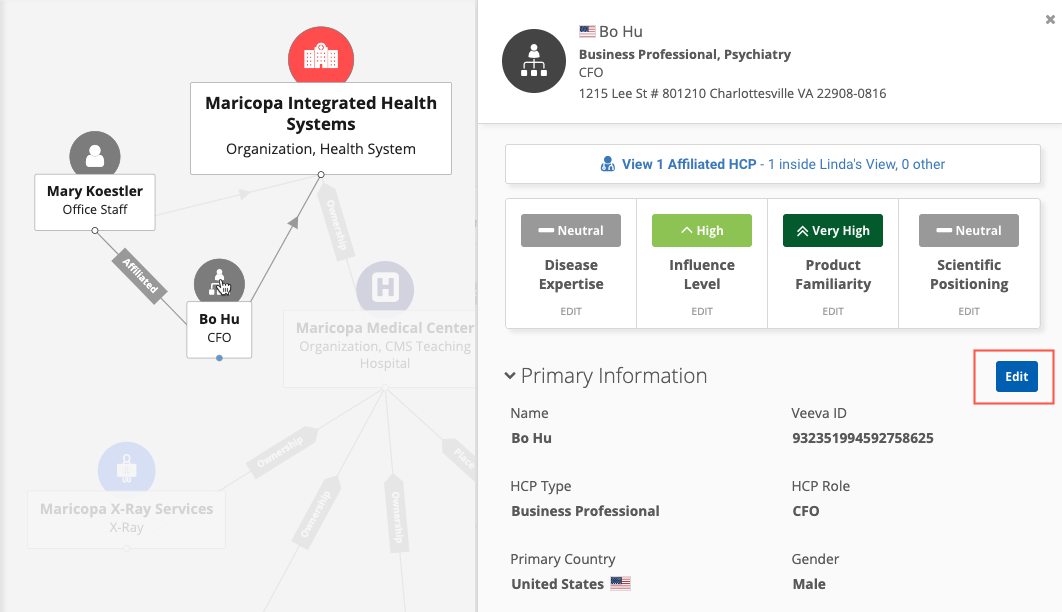
View HCP and HCO profiles
From the Influence Map view, click an HCP or HCO to explore the profile. When you click an icon, all of the connections are highlighted on the view and the profile preview opens in the right pane. Scroll through the profile to view all of the details that are available in the Network application; for example, Primary Information, Addresses, Licenses, Parent Affiliations, and so on.
Edit profiles
An Edit button is available on profile previews so you can immediately update a record. This is particularly useful for updating the entity labels that display on Influence Map to support HCP and HCO filtering. For example, if you download a record from Veeva OpenData and the field that you use for the entity label (for example, HCP Role or HCO Type) does not have a value, you can immediately add a value so that record can be included in filtering.
Tip: If the Affiliation widget is embedded in the Network Portal and you want record data to be read-only, administrators can hide the Edit button. Use the Advanced settings in the Network Portal application.
Data components
Data components contain external data from Salesforce orgs (for example, Veeva CRM and Salesforce Service Cloud™) about accounts. In the Affiliation widget, you can view data for multiple accounts (all accounts on the Influence Map) or for a single account (on the profile preview).
Multiple accounts
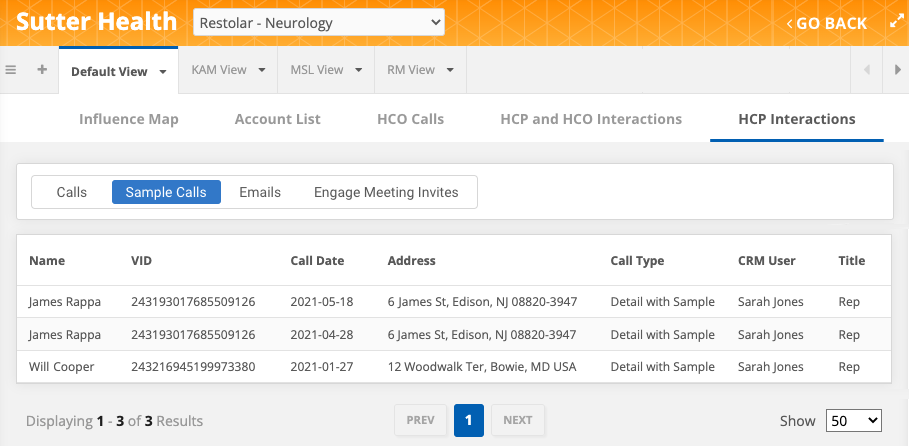
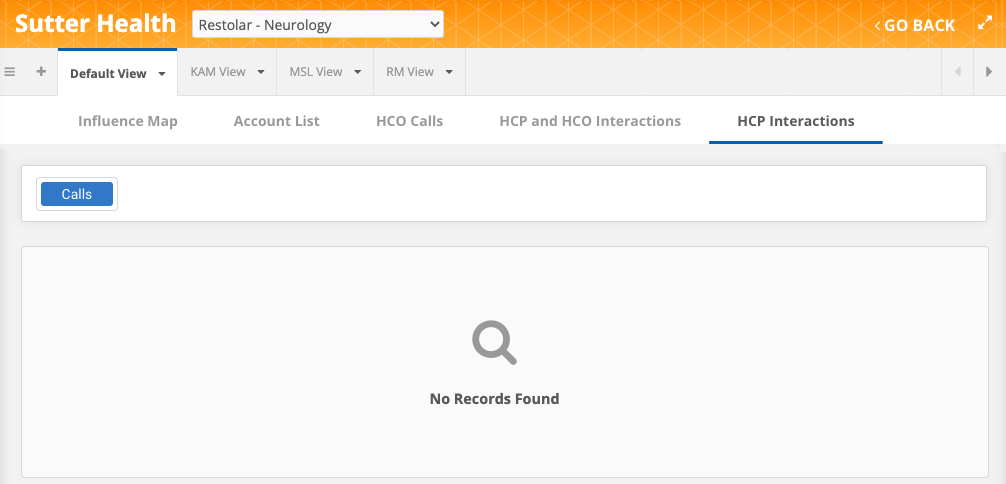
When data components are configured for the widget, they display alphabetically after the Influence Map and Account List tabs on each view. Tabs display if you have permission to view them through your assigned user groups.
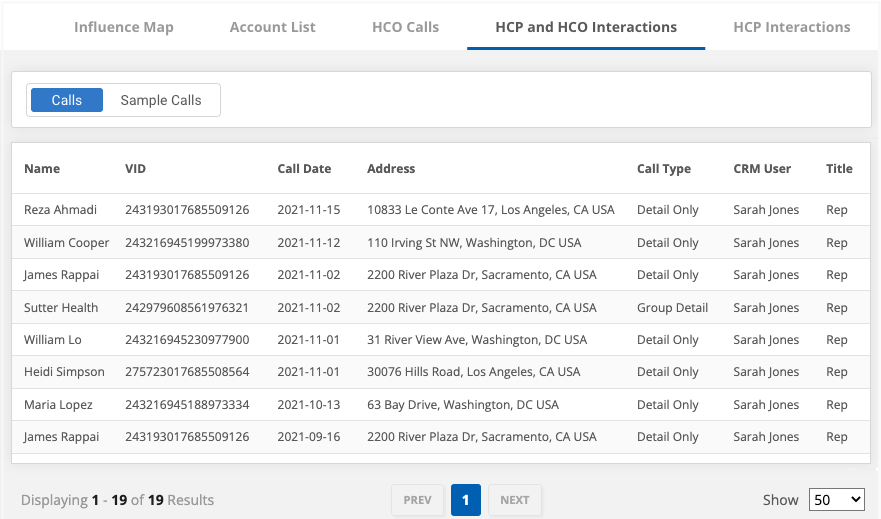
The data component contains data for all of the objects on the Influence Map. For example, you can see emails sent to all HCPs from Veeva CRM or view recent calls for all HCPs.
-
Click the tab to display the data component in the main pane.
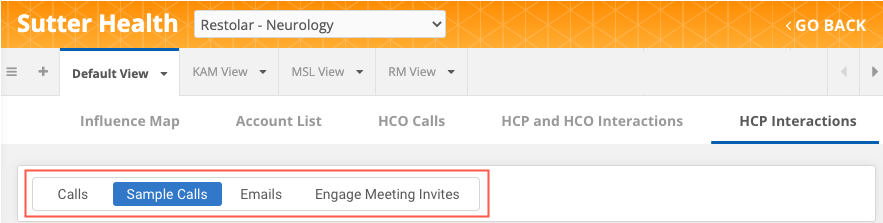
Each data component can contain multiple queries. Within the data component, click the tabs to view specific data for the accounts.
The data updates as you make changes to the Influence Map. For example, if you remove an account, the related data is removed in the data component. If you add an account, the data component query refreshes to include data for that account.
Navigation
Each component displays in a table view to accommodate the data for multiple accounts. By default, 50 rows display, but you can customize this using the Show list. Use the Prev and Next buttons to page through the results.
Each data component can contain results for a maximum of 150 accounts. If there are more accounts on the Influence Map, only 150 results are returned in the data component for the specified object type.
Tip: The table cannot be sorted from the Affiliation widget, but administrators can pre-sort the table using the ORDER BY function in the data component query.
If there is no data for a component, a No Records Found message displays.
If the warning message, Something Went Wrong displays, there could be a query syntax error or invalid credentials. Contact your administrator.
Single account
If data components are available for the record, the Data Components button displays on the profile when you view an account.
Administrators can customize the button name on the Data Component Settings page; for example, it might be called CRM Data. The button does not display if data components are not defined for the widget or do not apply to the profile.
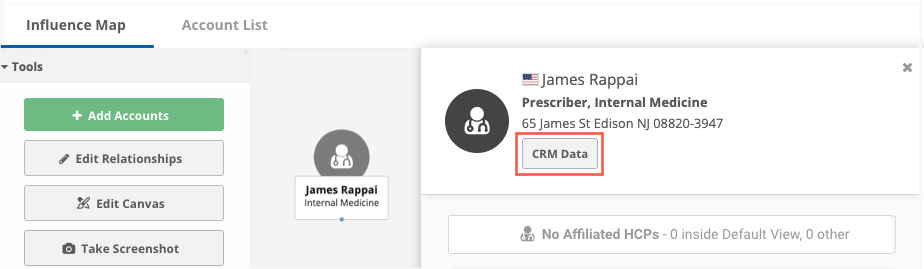
Click the button to display the dialog.
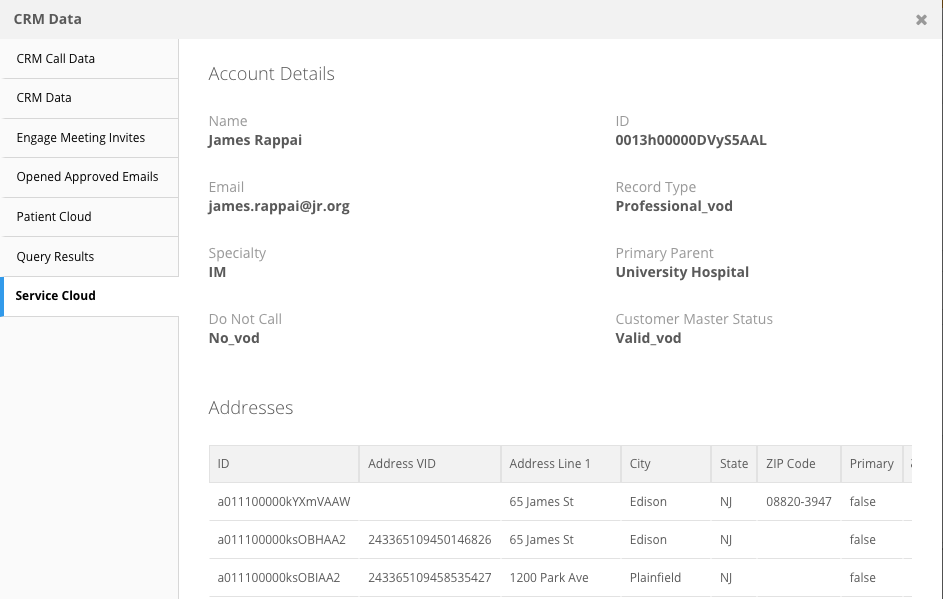
The first available data component displays. Additional data components are listed alphabetically in the left pane. By default, 25 results are shown in the data component table view. Use the Show list to customize the number of results that display for each table.
The external data on the data components is read-only.
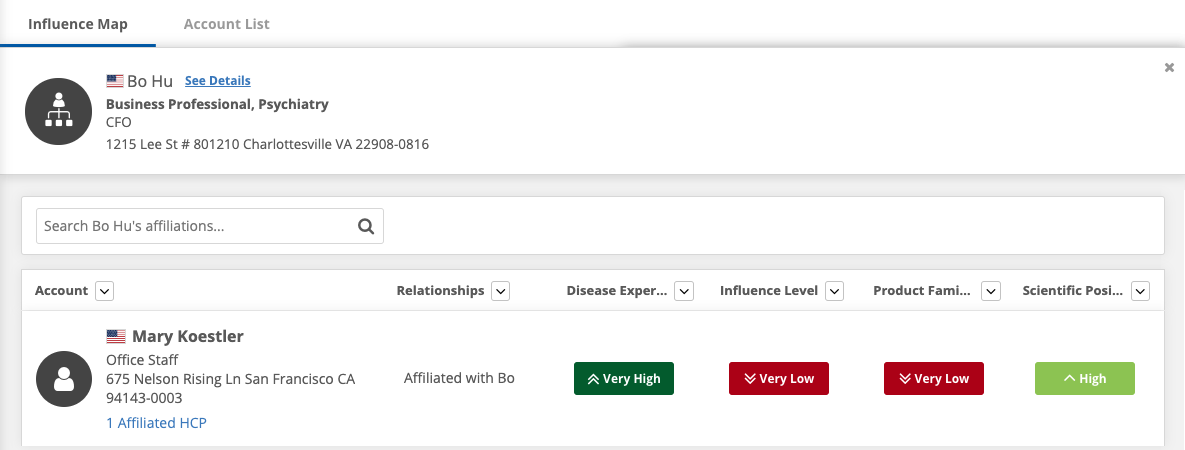
View affiliations
The profile preview contains a link to view HCP affiliations. The count displays active affiliations only for the selected health care system, product, and therapeutic area. Click the link to open the affiliations in a table.
The Relationships column describes how the HCPs are affiliated and the direction of the relationship. For example, an HCP might be connected because they give referrals or seek advice.
The following actions are available from this view:
- View the HCP's profile - Click the See Details link beside the HCP's name.
- View an affiliated HCP's profile - Click the row to open the profile preview in the right pane.
- View an affiliated HCP's affiliations - Click the <#> Affiliated HCPs link in any of the rows. This action refocuses the table on that HCP.
-
Sort the table - Click the Arrow icons at the top of any of the columns and choose an option to filter the table on. HCPs that match the filter display in the table. Multiple filters can be selected.
- Edit metrics - Click any metric rating to make an update.
Edit metric ratings
Any user can edit metric ratings for HCPs and HCOs. For example, a sales rep might change an HCP's Product Familiarity rating from Neutral to High after meeting with them.
Metric ratings can be updated from the profile preview or the Table View. If a rank has not been set for a metric, Not Ranked displays.
To update a metric rating:
- Click the rating to open the Edit dialog box.
- Select the new rating and click Save.
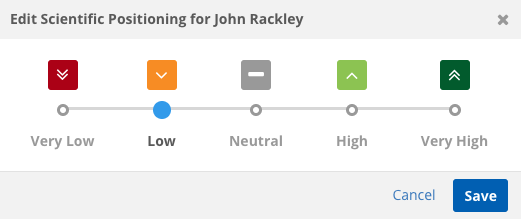
Updates are immediately available in the widget.
Remove relationships and affiliations
When a relationship is removed in the widget, it is not inactivated in your Network instance; a DCR is not created. The relationship is hidden from the widget and no longer displays. When an affiliation is removed, it no longer displays in the widget.
- To remove a relationship or affiliation, hover over the connecting line and click the Edit icon. In the Edit Relationships pop-up, click the Delete
 icon.
icon.
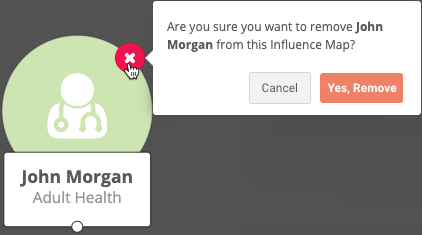
Remove accounts
You can remove individual accounts from a view if they are no longer relevant or were added by mistake. Removing accounts remove them from the view; it does not remove them from your Network instance.
To remove an account:
- In the Tools section, click Edit Mode. The nodes on the accounts display the supported actions (add and remove).
- Click the Remove (x) icon.
- In the pop-up, click Yes, Remove.
Using the Account List
The Account List tab displays the HCP affiliations for the selected view and product/therapeutic area. A summary for each HCP, their affiliations, and their metric ratings display in the table.
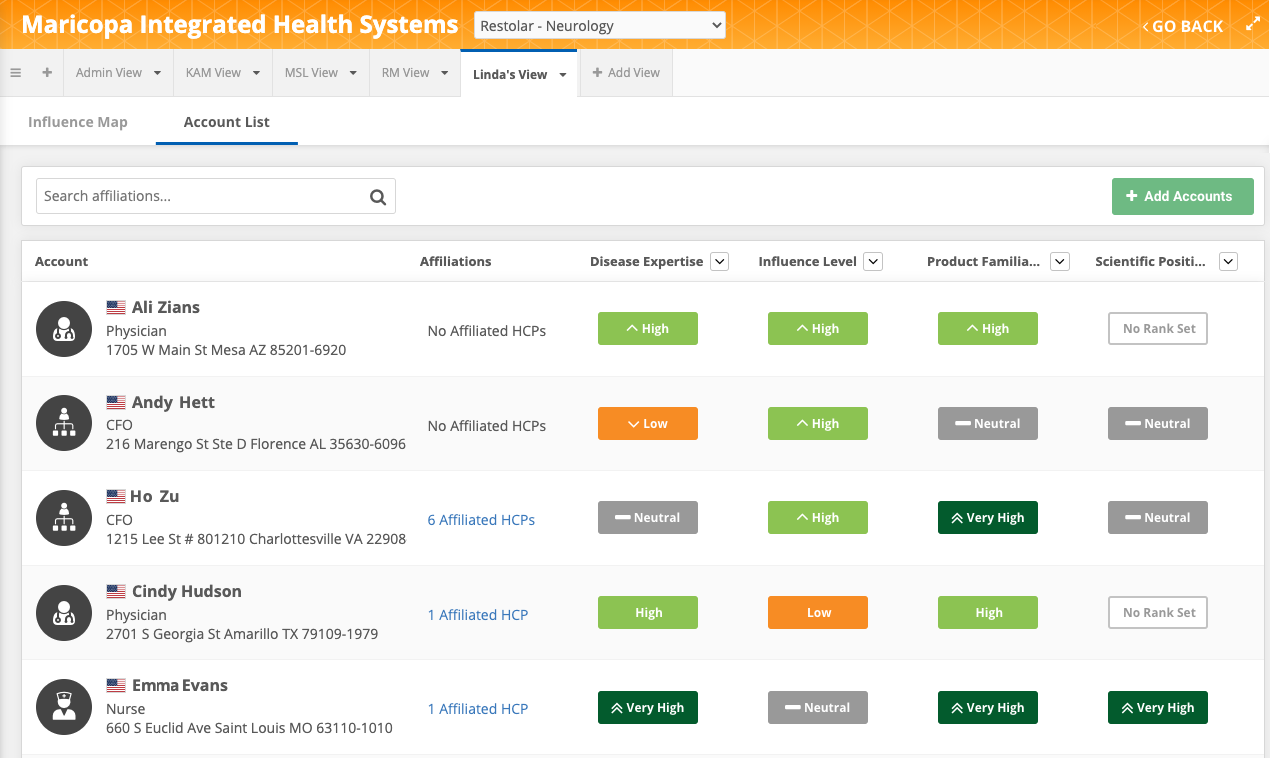
View affiliated HCPs
If an HCP has affiliations, a count displays in the Affiliations column. Click the link to open a new table that displays the list of affiliations for that HCP.
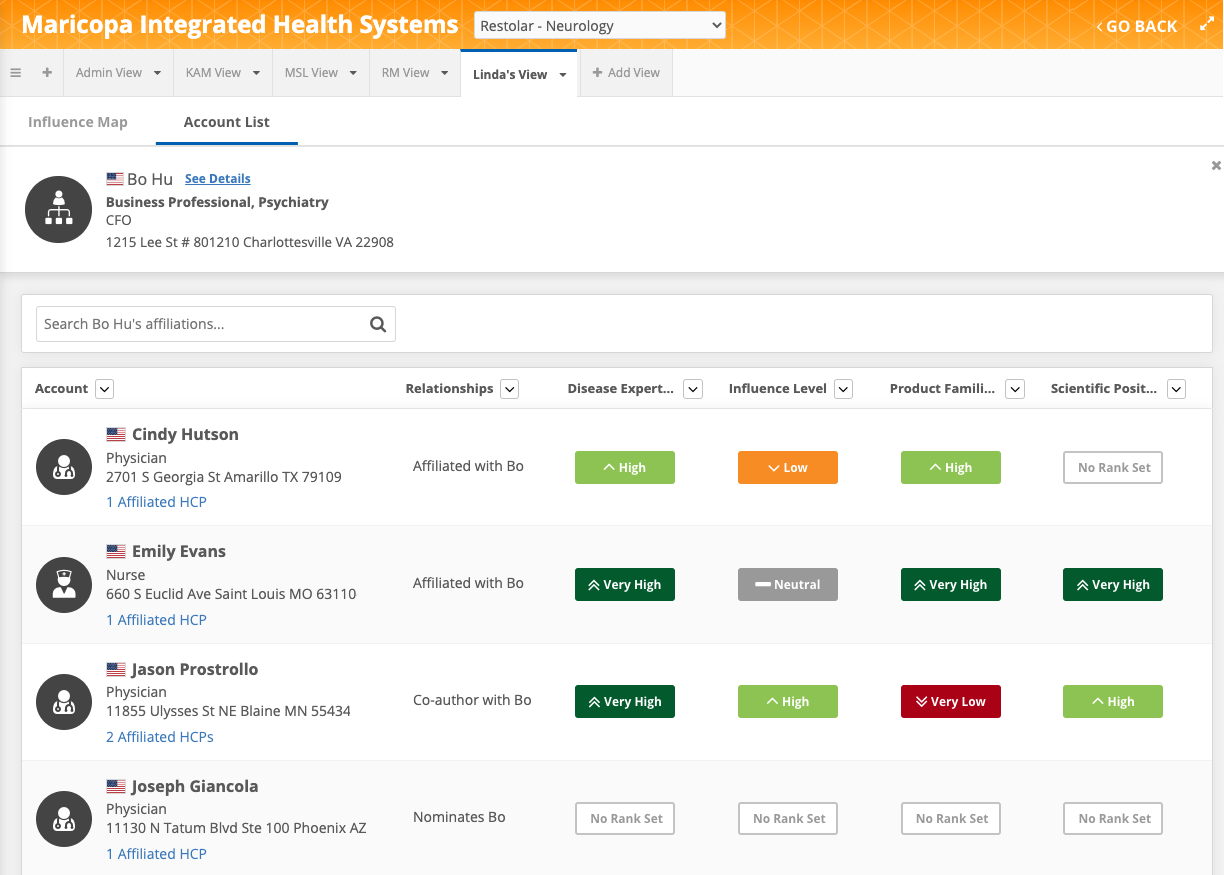
Click the x icon to close this view and return to the Account List.