Home dashboard
DM
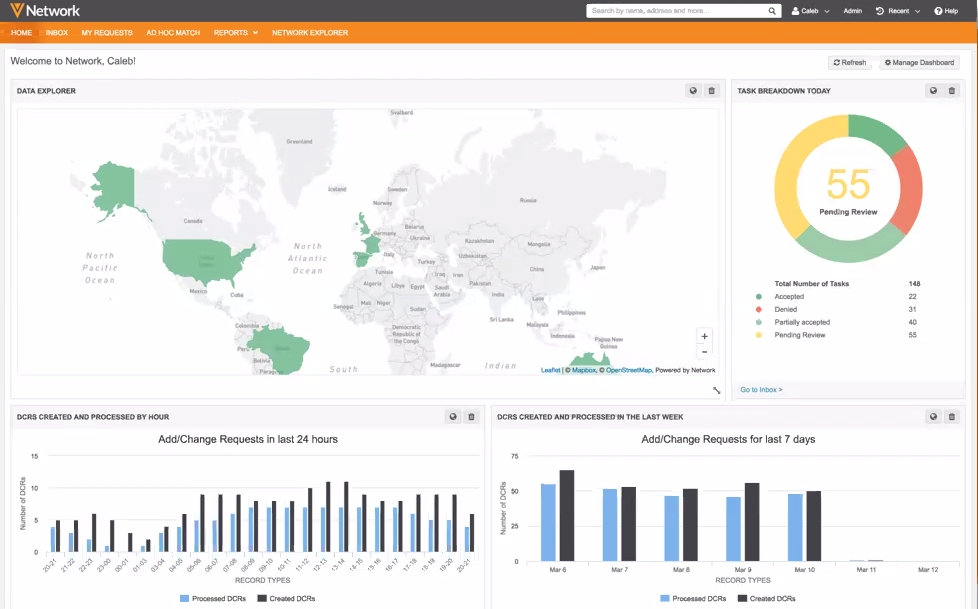
When administrators and data managers log in to Network MDM, they can access a home dashboard that contains a customizable view for admin data widgets. The dashboard widgets provide instant access to information that is important to these users.
The Home dashboard is not available for data stewards or standard users.
Enable the dashboard
Administrators can enable the Home Dashboard feature for their Network instance.
- In the Admin console, click Settings > General Settings.
- In the User Interface Options section, select Home Dashboard.
When administrator and data managers log into the Network instance, a personal and customizable dashboard displays.
Add and remove dashboard widgets
On the Network home page, click Manage Dashboard. A list of all available dashboard widgets display for your user type. Widgets are selected if they currently display on your home dashboard. Select or clear the checkboxes to choose the widgets for your home dashboard.
Widgets can also be removed by clicking the Remove ![]() button in the top right corner of a widget.
button in the top right corner of a widget.
Note: Dashboard widgets are different than Network widgets. Dashboard widgets are predefined previews of data in your Network instance.
Available widgets
The following dashboard widgets are available for specific user types.
| Dashboard Widget | Data Manager | Administrator |
|---|---|---|
| Data Explorer |
|
|
| Data in my Instance |
|
|
| Data Quality Results |
|
|
| DCRs Created and Processed by Hour |
|
*
|
| DCRs Created and Processed in the Last Week |
|
*
|
| Last 10 Import Jobs |
|
|
| Last 10 Source and Update Jobs |
|
|
| Number of API Searches |
|
|
| Steward Productivity over Time |
|
*
|
| Task Breakdown Today |
|
*
|
* Administrators must be assigned to inbox task groups to have access to the available data.
Move widgets
You can arrange the placement of the widgets on your home dashboard.
-
To move a widget, click the header and drag it to another position on your dashboard.
Dashboard widgets
Customize your home dashboard using the following widgets.
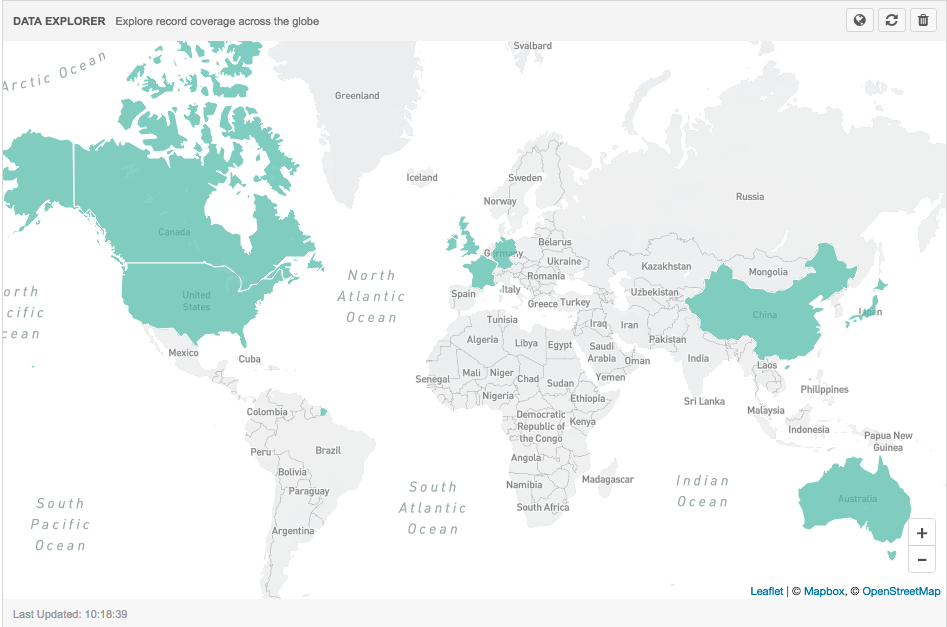
Data Explorer
This map widget highlights all of the countries that you have visibility to through your data visibility profile, even if there is no data for that country in your Network instance. The number of data visibility profiles that you have determines the default view of the map:
- One DVP - the map is zoomed into that country.
- Multiple DVPs - the world map is the default view.
Actions:
- Click the World
 button and select a specific country. Selecting a country has the following behavior:
- The map zooms into that country and displays a legend in the top right corner.
Zooming out or panning switches to the world view in the country picker.
Zooming in or clicking the same country keeps you in the country's context.
- The map zooms into that country and displays a legend in the top right corner.
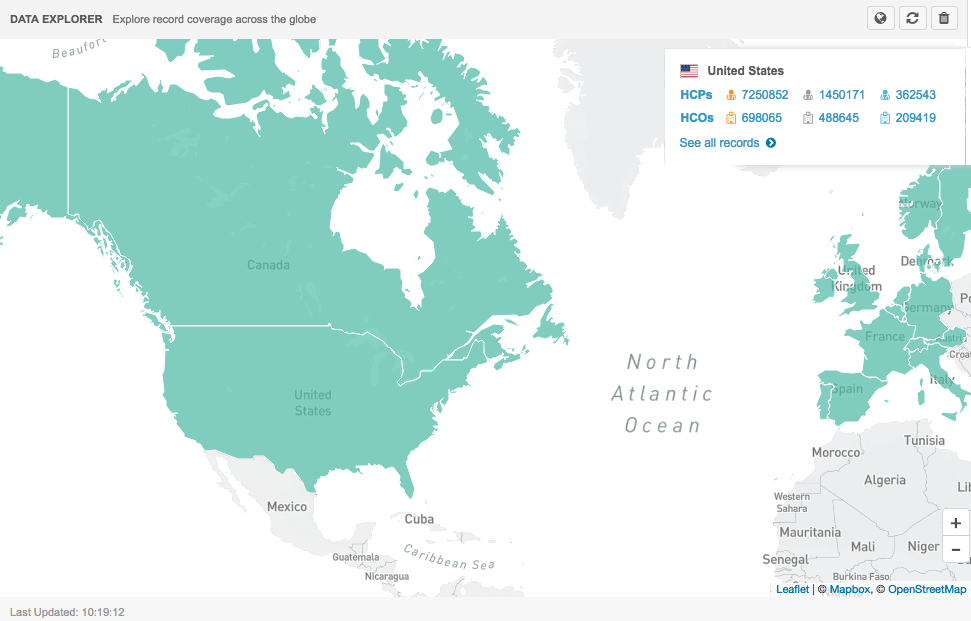
- Click on a country to display a summary count card of all of the record types by owner (customer, Veeva OpenData, third party master).
- Click any of the entity or count labels to search for those records.
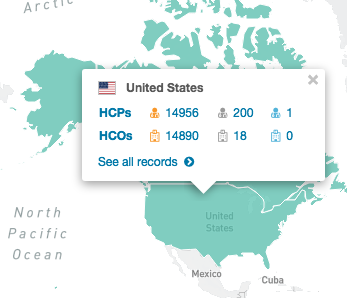
- Click See all records to go to the Search results for all.
Data in my Instance
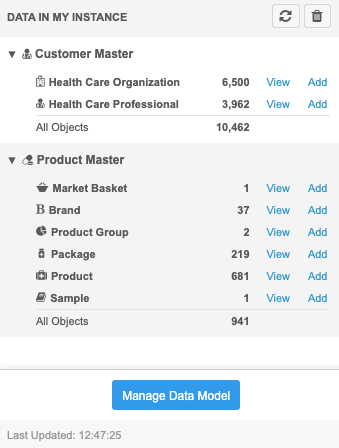
Provides an overview of the data domains and records that are loaded in your Network instance.
Use this dashboard widget to immediately find the following information:
- All the data domains that exist in the Network instance.
- All objects (standard or custom) that exist in these domains.
- The number of records loaded into the Network instance.
The Customer Master data domain displays first. Any custom domains that you have created in your Network instance display below the Customer Master domain. The domain cards are expanded by default so you can quickly view the object and record counts for that domain.
Object data
Each data domain displays the main objects in the domain. Beside each object, a total count of the valid records displays. This total includes the records for all countries and all data providers (local, Veeva OpenData, and third party data).
You can view the objects and record counts that you have access to through your data visibility profile permissions. If you do not have access to the objects in the domain, a message displays to explain why the objects are not available. A different message will display if there are no objects in the domain.
Note: Sub-objects do not display in the dashboard widget. You can obtain the total number of sub-objects in your instance using Network reports.
Actions
-
View - Click this link to navigate to the Network search results to see a list of all of the records for that object.
The total count of the records in your Network instance displays above the list of records.
-
Add - Click this link to submit a new record. In the Add Record dialog, the record type for that object is selected. Choose the primary country and click Next to complete the record information.
- Manage Data Model - Click the button to navigate to the Data Domains page to explore the domains.
This widget displays by default on the home dashboard for new administrator and data manager users. Existing users can add the widget to their dashboard.
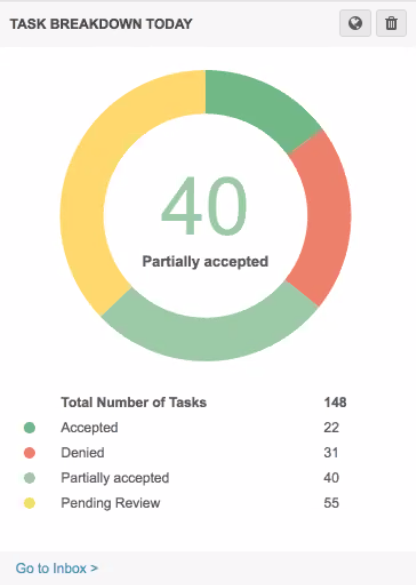
Task Breakdown Today
This dashboard widget displays all of the tasks in your local time (browser time). The widget queries the Inbox for the task information. The query uses the primary country defined for each entity and all the users that share the same inbox task groups as you.
Actions:
- Click Go to Inbox to navigate to the Inbox.
- If you have access to inbox task groups in more than one country, click the World button to select a specific country to display.
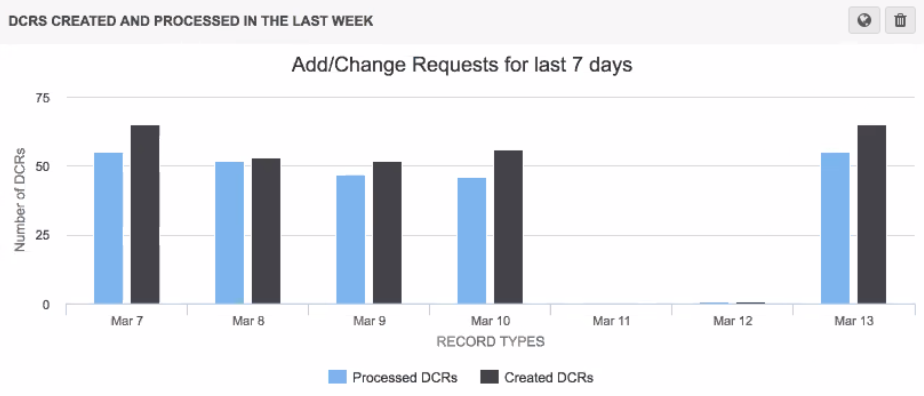
DCRs Created and Processed in the Last Week
Use this widget to access a breakdown of the number of created and processed DCRs for each of the countries that you have access to through your inbox task groups. The widget query is based on your browser time and includes weekends. A bar chart displays the last seven days, from the current day. The DCR count includes all of the DCRs that were processed by all users that have the same inbox task group that you do.
Actions:
- If you have access to inbox task groups in more than one country, click the World button to select a specific country to display.
DCRs Created and Processed by Hour
Use this widget to access the number of DCRs that were created and processed, by hour, in the last 24 hours. The query is based on your browser time and the countries that display depend on your assigned inbox task groups. The counts reflect the DCRs that were processed by users that are assigned to the same inbox task groups that you are assigned to.
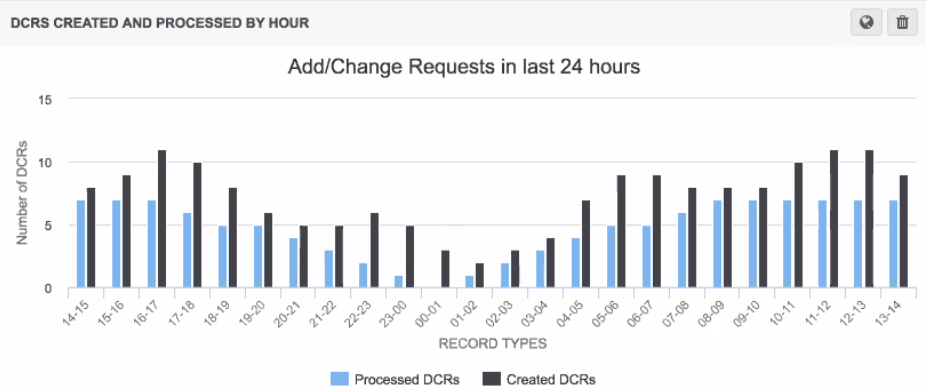
Actions:
- Click Go to Inbox to navigate to the Inbox.
- If you have access to inbox task groups in more than one country, click the World button to select a specific country to display.
Number of API Searches
This widget is available for administrators only.
Use the widget to access the number of Veeva CRM searches that occurred in the past week. The query is based on your browser time. The widget displays a bar chart for the last seven days from the current day.
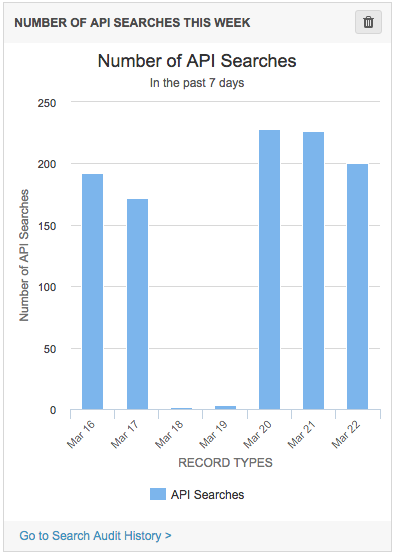
Actions:
- Click the Go to Search Audit History link to navigate to the Search Audit History.
Data Quality Results
Use this widget to access data quality results if a data quality report was run in the instance. The widget contains the latest run data. The widget displays all the entity groups and test cases, by default. To see the data by date, use the Data Quality Reports page.
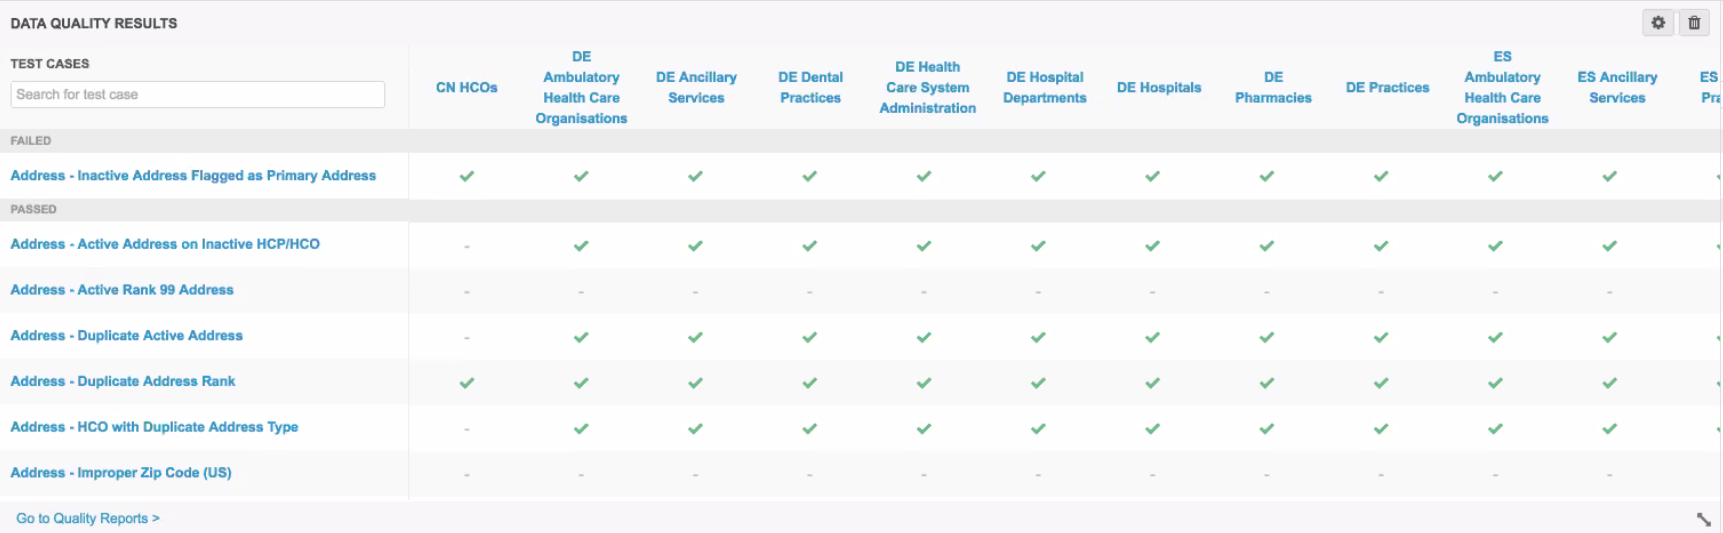
Actions:
- Click a test case or entity group to navigate to the Data Quality Reports page.
- Click the Customize
 button to choose the entity groups and test cases that display.
Steward Productivity over Time
Use this scorecard to access the number of processed task, by data steward, for the past week. All data stewards assigned to the same inbox task group that you are assigned to are listed on the scorecard. The query is based on your browser time. The widget displays the last seven days, excluding weekends. The buckets are dynamic, so the ranges will change depending on the available data.
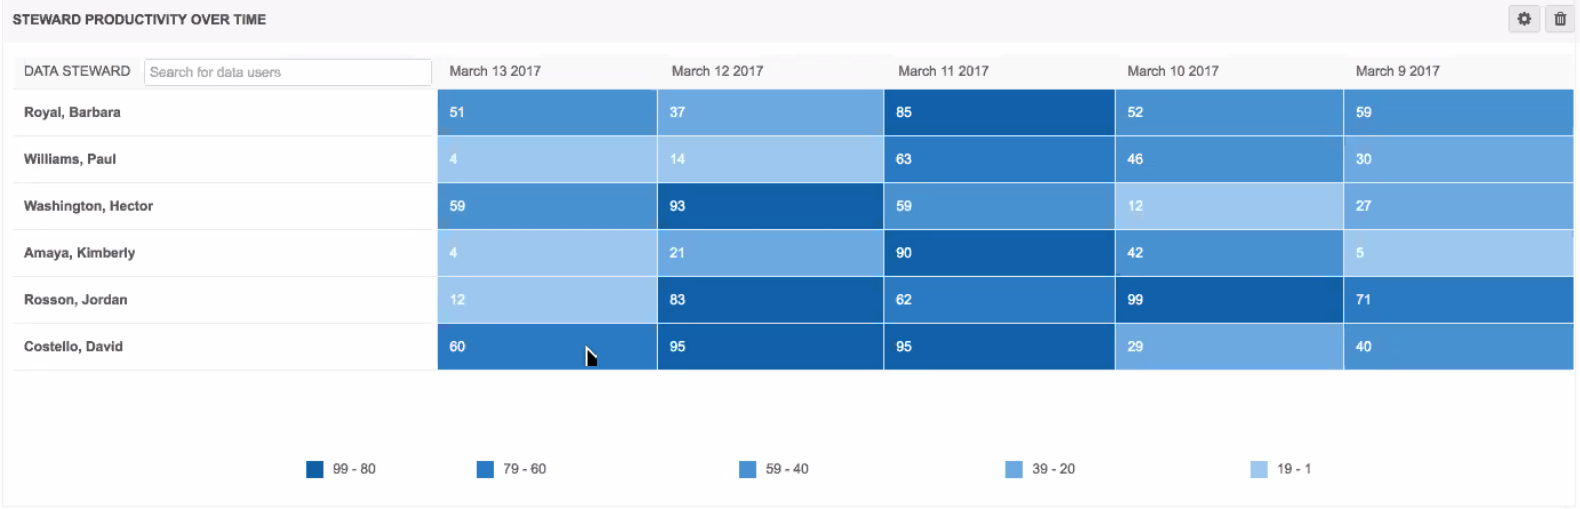
Actions:
- Select any number of active data stewards that belong to the same inbox task group.
Last 10 Import Jobs
This widget is available for administrators only.
Use this widget to view information about the last 10 jobs in the Network instance. The query is based on your browser time and the results are sorted by the last modified time of the job. The widget includes all import jobs; for example, source subscriptions, Veeva OpenData subscriptions, and data maintenance![]() User directed automated jobs that improve data quality by targeting specific data quality issues like sub-object inactivation and data deduplication detection. jobs. The list includes suspended, active, canceled, interrupted, paused, parked, stopped, completed, failed, and killed jobs. The number in the Add and Update columns is the sum of the columns in the Job Result Summary from the Job Details page (Added, Candidates Added, Updated, Invalidated, and Merged).
User directed automated jobs that improve data quality by targeting specific data quality issues like sub-object inactivation and data deduplication detection. jobs. The list includes suspended, active, canceled, interrupted, paused, parked, stopped, completed, failed, and killed jobs. The number in the Add and Update columns is the sum of the columns in the Job Result Summary from the Job Details page (Added, Candidates Added, Updated, Invalidated, and Merged).
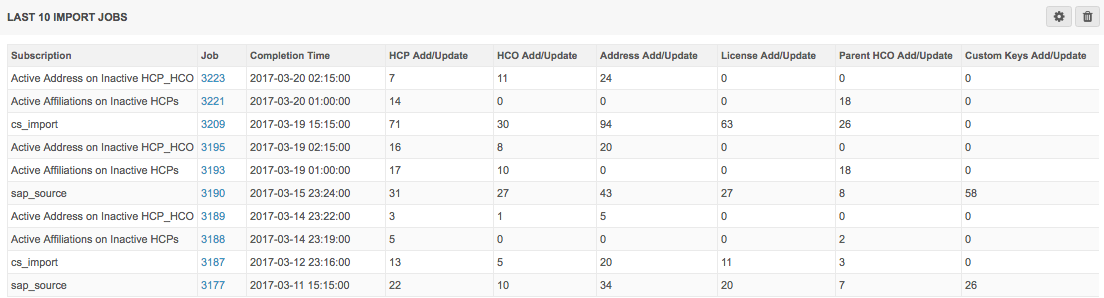
Actions:
- Click the Customize button to select the type of subscription that you want to view. If you select multiple subscriptions, the query lists the 10 jobs that were modified the most recently overall.
- Click the Job ID link to navigate to the Job Details page.
Last 10 Source and Update Jobs
The widget provides a summary of the most recent source and target subscriptions that have run. The table displays the entities and sub-objects that were added and updated during the job.
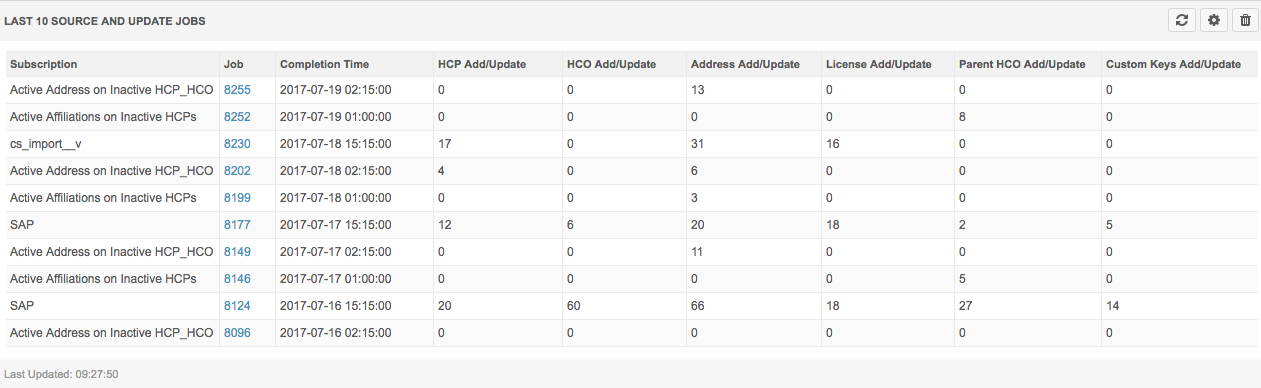
Actions:
- Click the ID in the Job column to go to the Job Details page for more information about the subscription job.
Refresh the home dashboard
The query data in the widgets are cached for an hour. Click Refresh or navigate away and back to the dashboard to see new data after 60 minutes. Click Refresh at any time to see if there are changes in the data. If there are changes, the new results are displayed and the Last Updated time is updated to the current time. If there are no changes in the data, the data doesn't refresh but the Last Updated time is updated to the current time.
If you log out of Network and log in again, the dashboard widget queries run again.
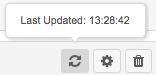
Refresh individual widgets
Refresh buttons are available on each widget so you can update individual widgets without updating the entire dashboard. Hover over the button to see the Last Updated time of the widget.
Note: The Refresh button on the Data Quality Reports widget does not re-run the data quality reports. You can run the reports again on the Data Quality Reports page.
The Refresh button is dimmed for 30 seconds after the data is updated. This prevents refreshing the widget too often.
After 60 minutes have passed for a widget, the home dashboard is refreshed when you navigate away from the page and back again.
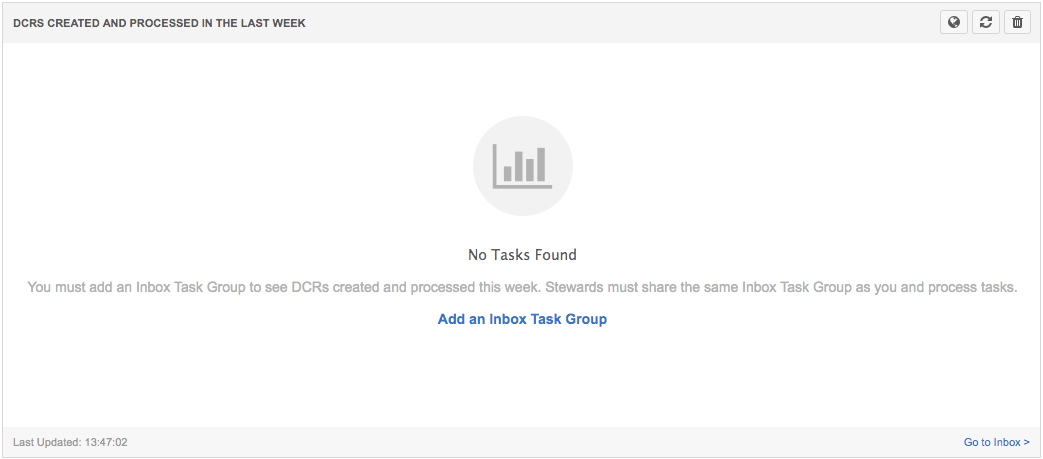
No widget data
If you do not have data for a widget on your home dashboard, the widget provides details about how data can be made available.
For example, if there are no tasks found for the DCRs Created and Processed in the Last Week widget, the message displays tips about adding an Inbox Task Group and ensuring that data stewards share the same Inbox Task Group as that administrator user.
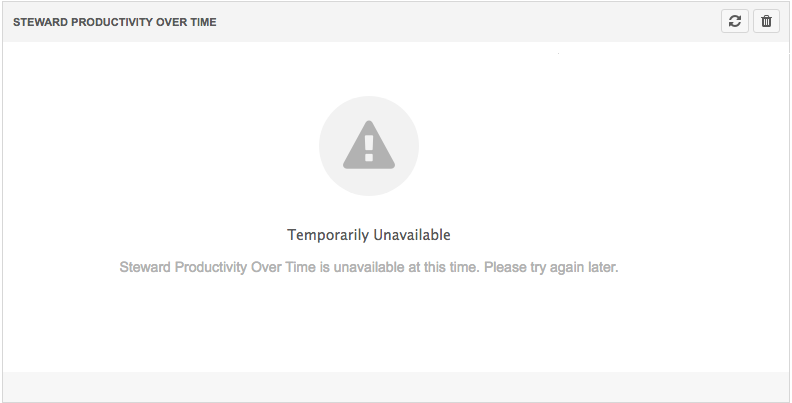
Unavailable widgets
If dashboard widgets are temporarily unavailable, a temporarily unavailable message displays in the widget. For example, the Data Quality Results widget can be temporarily unavailable if the reporting server is down.