Reports
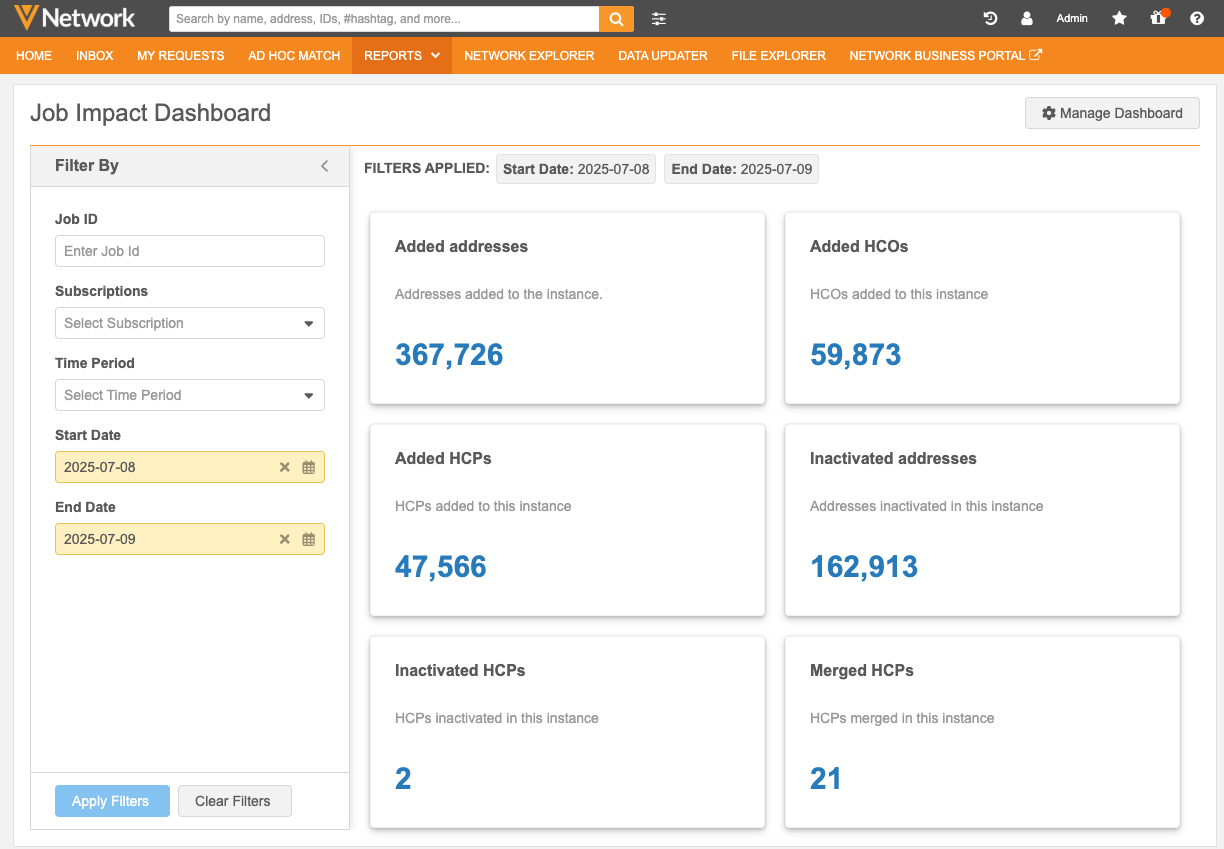
Job Impact Dashboard
A new dashboard can help you understand how jobs that add or change records have impacted your Network instance.
Each tile on the dashboard displays counts of the changes made by the jobs that you want to view. For example, you can view the changes made by a specific job or changes made by all jobs over the past day.
Network provides several predefined tiles and you can create custom tiles to query specific revision data.
This feature is enabled by default in your Network instance.
About the dashboard
All users with reporting access see the same Job Impact Dashboard. Any changes made to the dashboard apply to all users.
Each dashboard tile is a query that uses revision history reporting tables to provide a record count of the changes.
By default, six tiles display on the dashboard. To display additional tiles, click Manage Dashboard and enable them on the Job Impact Dashboard Settings page. A maximum of 21 tiles can be enabled.
Tile Details
-
Report (query) name
-
Description of query
-
Count of data changes
Click the count to open a Network table containing the record details.
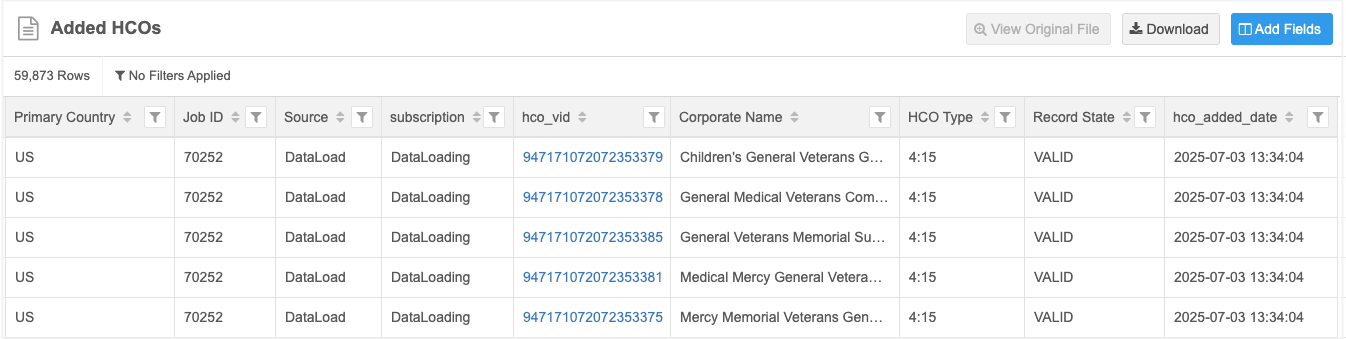
All Network table actions are available. For details see the Network tables topic in the Veeva Network Online Help.
Each VID is a link that opens the record profile in a new browser tab.
Supported objects
The dashboard can show changes for any enabled object in your Network instance by leveraging the related revision table.
-
Veeva standard objects (HCP, HCO, Address, License, Parent HCO, Custom Keys)
-
custom objects
Supported users
The Job Impact Dashboard uses Network's reporting feature to query the data and provide record counts. The dashboard is available for any user that has access to the Reports feature in the Network UI.
The ability to explore the results and manage the dashboard tiles depends on the permissions assigned to each user account.
Dashboard access
Administrators must configure the following settings for users to access the Job Impact Dashboard.
| Level | Access | User Type | Required Configuration |
|---|---|---|---|
| Network instance | Display Reports feature on the Network menu bar | Not applicable | Enable the Reporting View setting in Settings > General Settings. |
| User level permissions | View dashboard and work with SQL queries |
Data Steward
Standard User System and Data Admin |
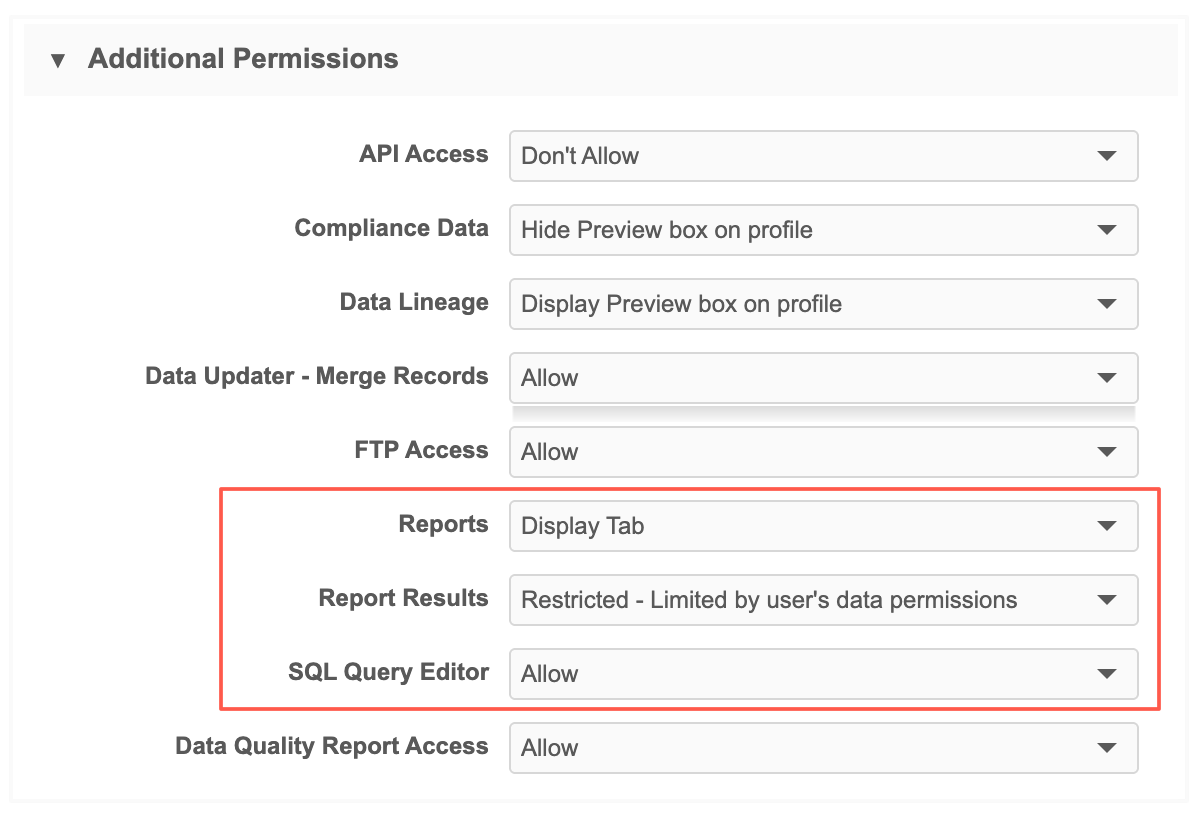
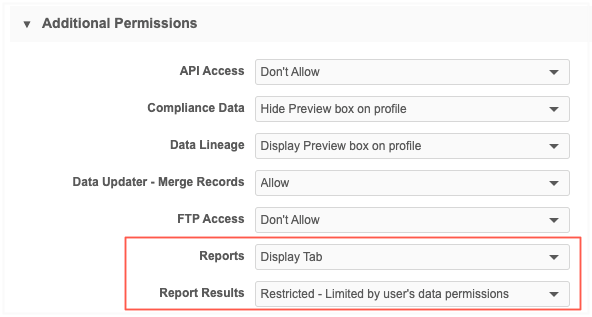
In the Additional Permissions section on each user account, set the following options:
|
| View dashboard results and work with SQL queries | Data Manager System Admin |
In the Additional Permissions section on each user account, set the following option:
These user types have access to the SQL Query Editor by default once the Reports option is set to Display Tab. |
|
| Data Manager
Data Steward Standard User System Admin System and Data Admin |
The Report Results setting determines the data the users can access in the dashboard results.
|
Example user permissions
Data Stewards, Standard users, System and Data Admins
Administrators must set the following permissions for these user accounts:
-
Reports - Set to Display tab.
-
SQL Query Editor - Set to Allow.
System Administrators and Data Managers
Administrators must set the following permissions for these user accounts:
-
Reports - Set to Display tab.
Access the dashboard
The Job Impact Dashboard can be accessed from the Reports menu or from any source system or subscription that adds or changes data in your Network instance.
Network menu bar
-
Click Reports > Job Impact Dashboard.
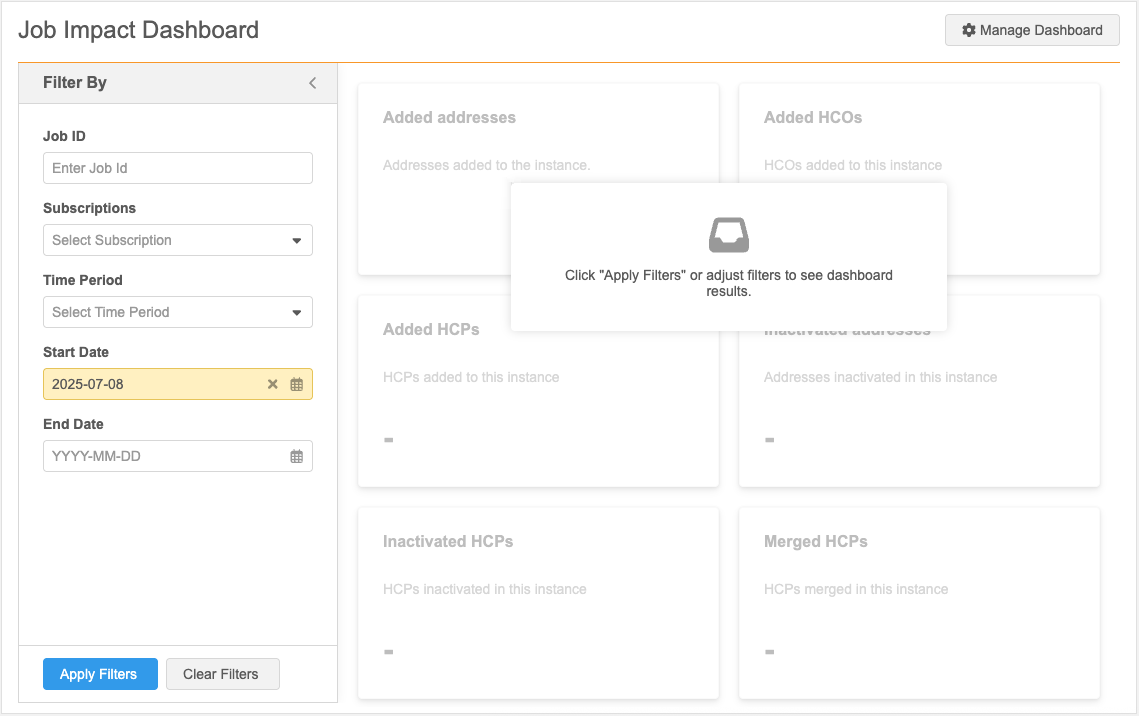
When you open the dashboard, no filters are applied. Use the Filter By panel to choose the job data that you want to view.
By default, the Start Date filter is set to yesterday's date.
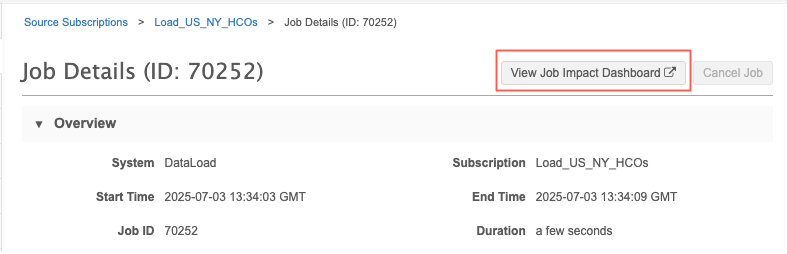
Access the dashboard from a system or subscription
Systems and subscriptions contain a View Job Impact Dashboard button in the Job History section or on Job Details page. When you navigate to the dashboard from a specific subscription or job, the dashboard is automatically filtered to show you the relevant details.
Example
Filter the dashboard
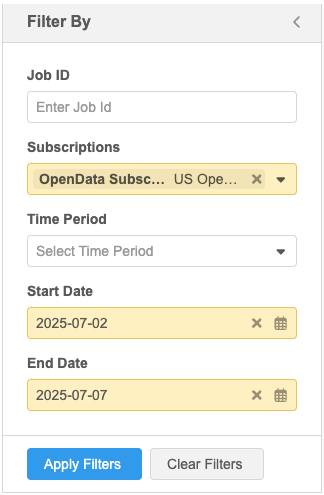
Use the Filter By panel to choose the job data that you want to view.
Filter options
-
Job ID - Type a specific job ID.
Job ID filters ignore all other defined filters because it's for a specific job.
-
Subscriptions - Displays all subscriptions that add or change data in your Network instance.
-
Time Period - Specify a duration.
-
Last day
-
Last 7 days
-
Last month
-
Last 3 months
-
-
Start Date - Specify the first day to query data changes.
If a Time Period or Start Date is not defined, the default value is yesterday.
-
End Date - Specify the last day to query the data.
If you select a Time Period, the Start Date and End Date are automatically filled.
Important: The dashboard can return results for a maximum three month period. If the Start Date and End Date duration is longer than three months, an error displays.
Filter by subscription
The Subscriptions filter contains all subscriptions that add or change data in your Network instance.
Choosing a job type (for example, OpenData Subscriptions) will return results for all subscriptions listed in that section. Alternatively, you can choose one or a few subscriptions under one or multiple job types.
Supported subscriptions
Subscription jobs are organized into categories and listed alphabetically.
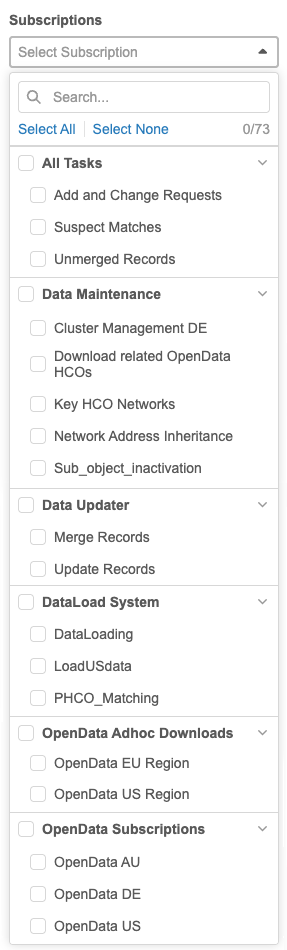
| Job Type | Subscription |
|---|---|
| Tasks | Add and Change Requests |
| Suspect Matches | |
| Unmerged Records | |
|
Data Maintenance Includes Data Maintenance subscription jobs and other related jobs. |
Anonymize Deleted HCP Records |
|
Cluster Management (listed by country using the 2-letter country code) |
|
| Data Deduplication | |
| Delete Custom Object Records | |
| Delete Locally Managed Records | |
| Download related OpenData HCOs (OpenData subscription setting) | |
| Key HCO Networks | |
| Network Address Inheritance | |
| Sub-object Inactivation | |
| Unsubscribe from OpenData Records | |
| Data Updater | Merge Records |
| Update Records | |
| OpenData Ad Hoc Downloads |
One-time download or update using the following ad hoc jobs:
For details about ad hoc jobs, see Downloading records from Veeva OpenData. Jobs are organized by OpenData regions (for example, OpenData EMEA Region). For details about these regions, see OpenData countries. |
| OpenData Subscriptions |
Enabled individual country subscriptions are listed using the 2-letter country code (example, OpenData GB) |
| Source Subscriptions |
Categorized system name. Each subscription associated to the system is listed alphabetically.
|
Data maintenance
In the Data maintenance filter category, the following data maintenance jobs are listed by the user-defined subscription name in ascending alphabetical order:
-
Anonymize Deleted HCP Records
-
Data Deduplication
-
Delete Custom Object Records
-
Delete Locally Managed Records
-
Hard Delete Custom Object Records
-
Sub-Object Inactivation
-
Unsubscribe from OpenData Records
Manage your dashboard
Click Manage Dashboard to manage the available tiles and to create new tiles.
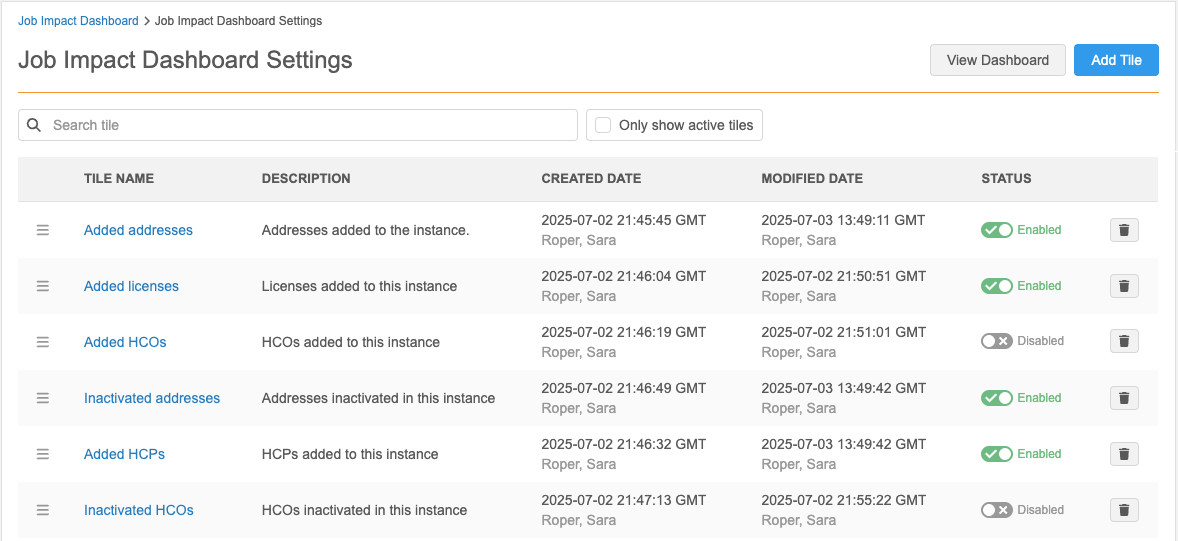
Available actions
-
Search - Find a tile by keyword in the Name or Description.
-
Enable - Display a tile on the dashboard.
-
Disable - Remove a tile from the dashboard.
-
Re-Order - Use the Handle
 icon to move a tile to a different position on the dashboard.
 -
View tiles - By default, all tiles display. To view enabled tiles only, select Only show active tiles.
-
Delete - Remove a tile from your Network instance. (Admin and System & Data Admin users only).
-
Edit tiles - Update the existing tiles. Click the name of the tile to open the details page.
-
Create tiles - Click Add Tile to define a custom query.
Available tiles
Network provides the set of predefined tiles (queries).
| Tile Name | Description |
|---|---|
| Added addresses | Addresses added to this instance. |
| Added custom keys | Custom keys added to this instance. |
| Added licenses | Licenses added to this instance. |
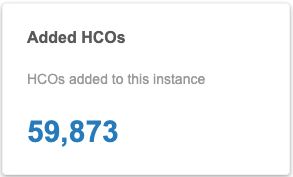
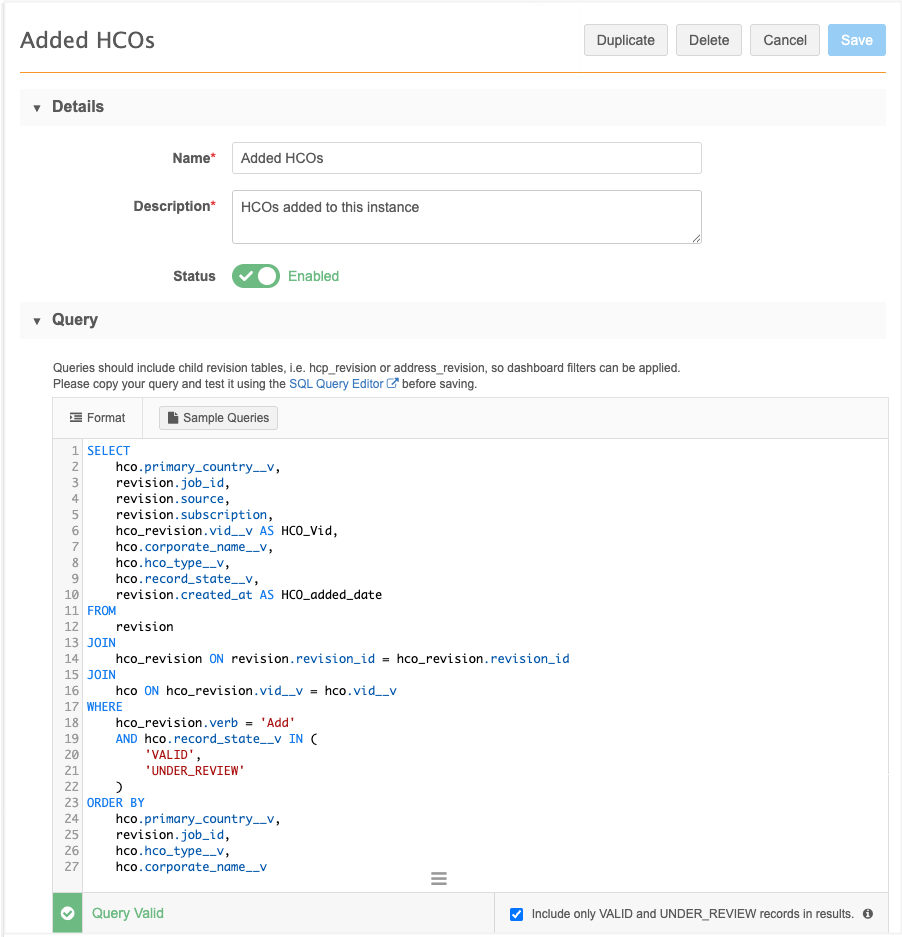
| Added HCOs | HCOs added to this instance. |
| Added HCPs | HCPs added to this instance. |
| Added Parent HCOs | Parent HCOs added to this instance. |
| Inactivated addresses | Addresses that have been inactivated. Results include addresses with any record state that have their address_status__v field changed to "I". |
| Inactivated custom keys | Custom keys that have been inactivated. Results include custom keys that have their custom_key_status__v field changed to "I". |
| Inactivated HCOs | HCOs that have been inactivated. Results include HCOs with any record state that have their hco_status__v field changed to "I". |
| Inactivated HCPs |
HCPs that have been inactivated. |
| Inactivated licenses | Licenses that have been inactivated. Results include licenses with any record state that have their license_status__v field changed to "I". |
| Inactivated Parent HCOs | Parent HCOs that have been inactivated. This query returns Parent HCOs with any record state that have their parent_hco_status__v changed to "I". |
| Invalidated addresses | Addresses that have been invalidated. Results include addresses with any record state that have their record_state__v changed to "INVALID". |
| Invalidated custom keys | Custom keys that have been invalidated. Results include custom keys with any record state that have their record_state__v changed to "SD" (Source Deactivated). |
| Invalidated licenses | Licenses that have been invalidated. Results include licenses with any record state that have their record_state__v changed to "INVALID". |
| Invalidated HCOs | HCOs that have been invalidated. Results include HCOs with any record state that have their record_state__v changed to "INVALID". |
| Invalidated HCPs | HCPs that have been invalidated. Results include HCPs with any record state that have their record_state__v changed to "INVALID". |
| Invalidated Parent HCOs | Parent HCOs that have been invalidated. Results include Parent HCOs with any record state that have their record_state__v changed to "INVALID". |
| Merged addresses | Addresses that have been merged. Results include the merge loser and the VID of the winning address record. |
| Merged HCOs | HCOs that have been merged. Results includes the merge loser and the VID of the winning record. |
| Merged HCPs |
HCPs that have been merged.
Results include the merge loser and the VID of the winning record. |
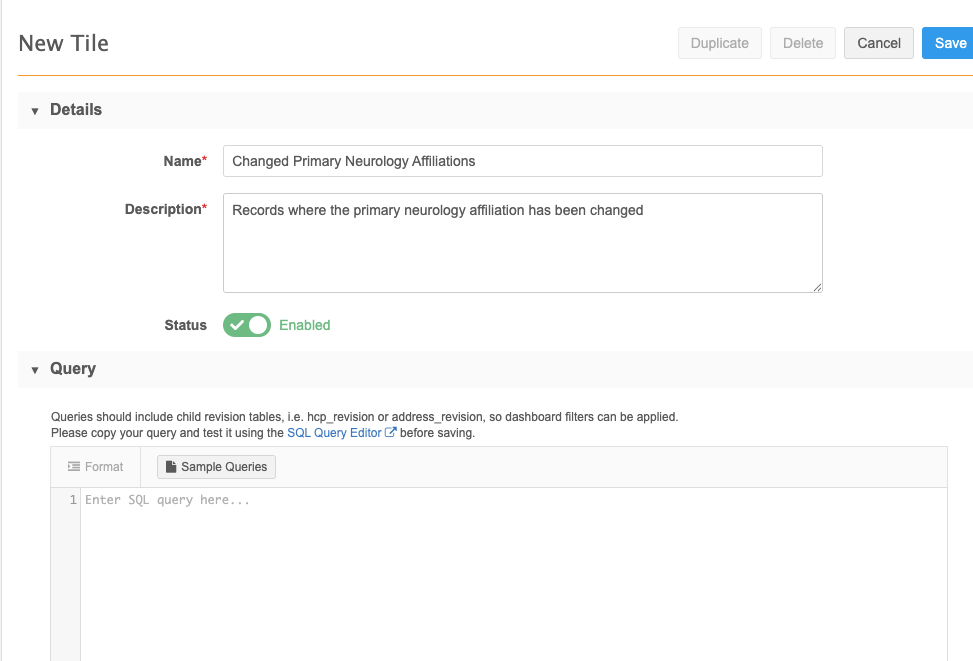
Add a tile
To create a custom tile:
-
On the Job Impact Dashboard page, click Manage Dashboard.
-
The Job Impact Dashboard Settings displays the list of tiles. Click Add Tile.
Important: The button is dimmed if there are 21 tiles enabled on the dashboard. Remove a tile from the dashboard by changing its status to Disabled. The Add Tile button will now be active.
-
On the New Tile page, define a meaningful Name and Description
-
In the Query section, add the SQL query for the tile. You can create a new query or customize any of the sample queries.
Options
-
Use a sample query - Use a sample query as a starting point. You can change the query to suit your requirements.
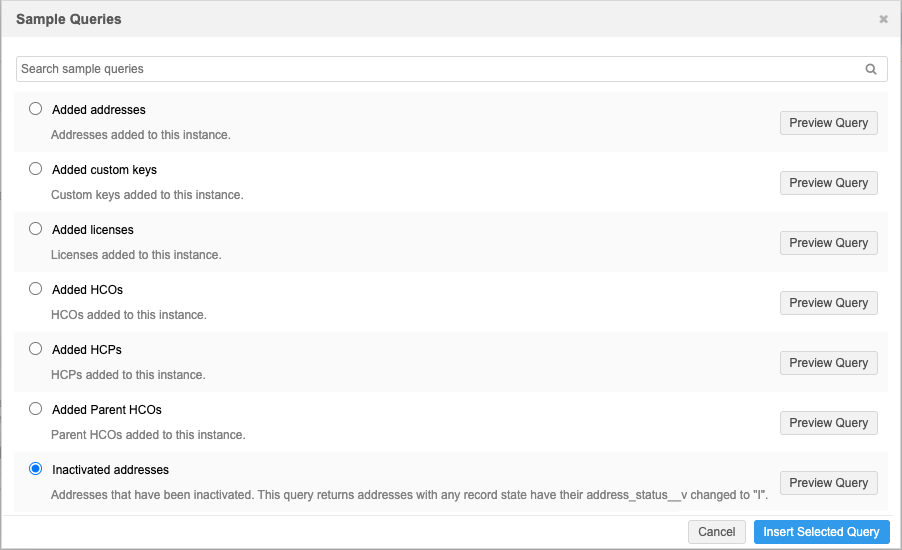
-
Create a query
The SQL of a query is validated as you type.
Tips for creating a SQL query:
-
Create the query in the SQL Query Editor to confirm it returns the desired results. Then, copy and paste the tested query into the New Tile page.
-
Queries must include revision history tables (for example, hcp_revision, address_revision) so the dashboard filters can be applied.
If a query does not include revision history tables, the query will run and a count will display but it will not use any filter selections.
-
Tile results count the rows returned by your query.
-
Results shown in the Network table include fields specified in the SELECT section of your query. Include at least the entity
vid__vfield so users can add additional columns in Network tables and so they can view individual profiles. -
Queries that include the created_at revision table field should not use aliases. Time filters cannot be applied if an alias is used. For example, avoid queries that include this and anything similar:
select revision.created_at AS Added_date from
-
-
Edit tiles
On the Job Impact Dashboard Settings page, click a tile name to view the details.
You can change any of the existing tiles by updating the name, description, status, or SQL query.
Tip: If you change a query, copy it to the SQL Query Editor to confirm it produces the desired results.
Logs
Administrators can track updates to the dashboard using the following logs:
-
System Audit History - View updates made to the tiles on the dashboard.
-
Reporting Audit History - Tracks queries run by the dashboard.