Building an aggregate report
DM
DS
ST
Use the Aggregate Report Builder to quantify data based on the columns, filters, and groups you define.
The HCO average hospital size by region report is an example of a report you can build with the aggregate report builder.
When you generate aggregate reports, you have additional options to display the results in chart form, as well as the default table form.
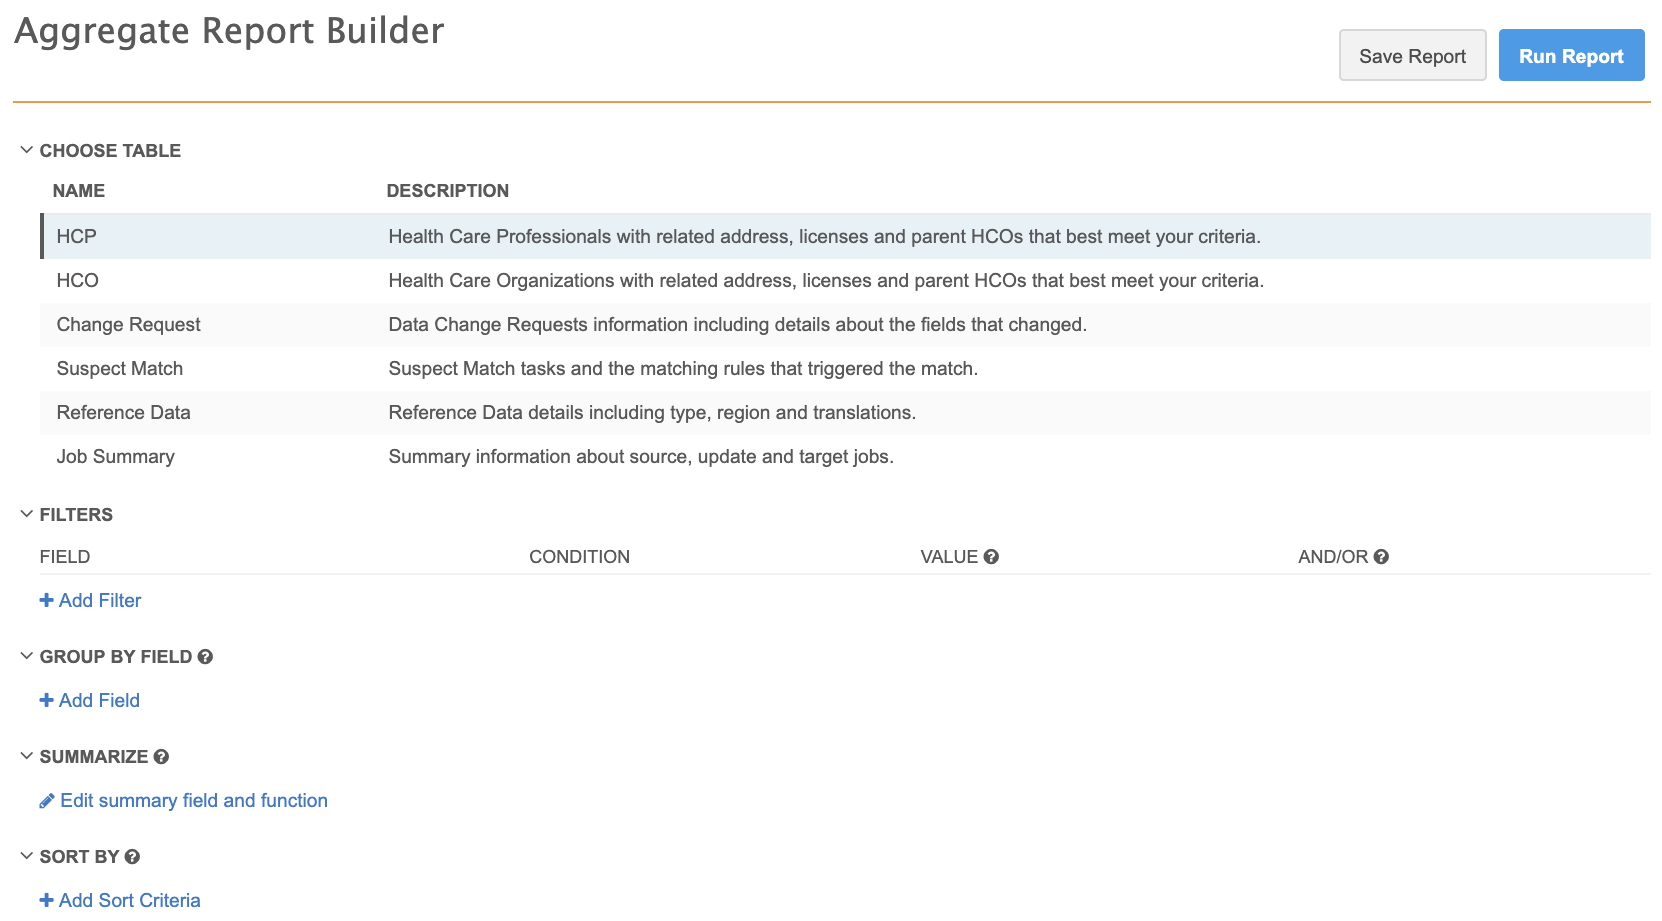
To begin building an aggregate report, on the , click Reports > Aggregate Report Builder.
Entity-level updates from Network MDM reflect in the reporting database in near real-time, though full processing can take up to 30 minutes. This means that you can report on updated data soon after changes are made
Select report type
In the CHOOSE TABLE section, select the type of report you want to build:
| Table Name | Description | Sample Report |
|---|---|---|
| HCP | Health care professionals with related addresses, licenses, and parent HCOs. | Finding HCPs by region/specialty |
| HCO | Health care organizations with related addresses, licenses, and parent HCOs. | HCO average hospital size by region |
| Change Request | Data change request information, including details about fields that have changed. Only data stewards or users with inbox task groups can access this report type. | DCR details |
| Suspect Match | Suspect match tasks and the match rules that triggered the match. Only data stewards or users with inbox task groups can access this report type. | Suspect match details |
| Reference Data | Reference data details including the type, region, and associated translations. | Localized reference data in entity |
| Job Summary | Summary information about source, update, and target jobs. Only administrators and data managers can access this report type. | Example job queries |
Note: If you change the report type after you have defined columns, filters, and sort criteria, your definitions will be lost.
Add filters
Click +Add Filter to add one or more filter expressions to limit the query results. You can reorder filters by clicking and dragging the handles beside each filter.
Expand each section for details on each part of the filter expression.
 Field
Field
Select the field you want to filter on.
Use Search to quickly find a field in the list; the list updates as you type.
The condition and value change according to the type of field you select; for example, if you select a date field, the CONDITION list includes Within the last and In the range, and the VALUE list includes a date picker or drop-down option.
Using sets of fields
In your reports, you can specify a field set so you don't have to list fields individually.
Example
To refine your query using HCP focus areas, you can specify All HCP Focus Areas in the basic report builder or hcp_focus_areas in the SQL editor; this value includes all 36 fields (hcp_focus_area_1__v to hcp_focus_area_36__v) in that set.
The following table contains all of the groups you can specify, along with their corresponding SQL field names and the individual fields that are included.
| Field Set | SQL Field Name | Data Model Fields |
|---|---|---|
|
All Accreditations |
hco_accreditations | hco_accreditation_1__v to hco_accreditation_10__v(Note: These fields are not considered a set for Japan). |
| All Address Lines | address_lines | address_line_1__v to address_line_3__v |
| All Alternate Names | alternate_names | alternate_name_1__v to alternate_name_10__v |
| All Credentials | credentials | credentials_1__v to credentials_5__v |
| All Delivery Address Lines | delivery_addresses | delivery_address_1__v to delivery_address_3__v |
| All Emails | emails | email_1__v to email_10__v |
| All Faxes | faxes | fax_1__v to fax_10__v |
| All HCO Focus Areas | hco_focus_areas | hco_focus_area_1__v to hco_focus_area_10__v |
| All HCP Focus Areas | hcp_focus_areas | hcp_focus_area_1__v to hcp_focus_area_36__v |
| All Medical Degrees | medical_degrees | medical_degree_1__v to medical_degree_5__v |
| All National IDs | national_ids | national_id__v to national_id_5__v |
| All Phones | phones | phone_1__v to phone_10__v |
| All Specialties | specialties | specialty_1__v to specialty_10__v |
| All URLs | URLs | URL_1__v to URL_2__v |
Condition
Select an operator for the expression. The values in this list change, depending on the field selected for the filter.
Basic conditions include the following:
- Equals - specified value matches an exact field value
- Not Equals - specified value does not match the field value
- Is Null - value is null
- Is Not Null - value is not null
- In - specified value matches one or more field values
- Find - specified value exists in the field value. This condition uses the SQL ilike operator.
- Not Find - specified value does not exist in the field value. This condition uses the SQL ilike operator.
Integer conditions add the following:
- Less Than - specified value is less than the field value
- Less Equals - specified value is less than or equal to the field value
- Greater Than - specified value is greater than the field value
- Greater Equals - specified value is greater than or equal to the field value
Date conditions vary and include the following:
- Less Than - includes records created earlier than the selected date
- Greater Than - includes records created later than the selected date
- Is Null - includes dates that are null
- Is Not Null - includes dates that are not null
- Within the last - includes records created within the specified number of days, weeks, months, or years from the current date
- In the range - includes records created within a set range
Value
Provide one or more values for the expression. Depending on the condition selected, this field can include zero or more values:
- Is Null/Is Not Null - cannot include any values
- Equals/Not Equals - can include one, case-insensitive value
- Find - can include multiple, case-insensitive values; any of the values can match the specified field value
- In - can include multiple, case-sensitive values; any of the values can match the specified field value
If the selected field is a reference type field, all valid reference values that are enabled in the Network MDM instance display in the VALUE field. Inactive reference values that are not enabled for any country do not display. To filter on inactive reference codes, use SQL query reports.
Note: You can filter on all fields including custom fields. For HCP and HCO reports, you cannot filter on parent HCO and parent HCO primary address fields, but you can filter on relationship fields.
AND/OR
Combine multiple expressions using AND or OR statements.
OR statements apply to all expressions above and below the current statement. For example, four expressions listed as 1 AND 2 OR 3 AND 4 would be interpreted as (1 AND 2) OR (3 AND 4).
Group and summarize fields
To define how data is displayed in the results, select one or more fields to group by and a field to summarize in the results.
- To define field groups that will appear in your table or chart, in the GROUP BY FIELD section, click + Add Field.
- Select a field from the list or begin typing to see auto-complete options.
- To add fields, click + Add Field.
If you have multiple fields in this section, you can reorder them by clicking and dragging the handles to the right of each field.
- To define the field to quantify, in the SUMMARIZE section, click the Field list and select a field, or begin typing to see auto-complete options.
Note that if the field type is numeric, other options display in the By list, such as Average, Count, Sum, Max, Min, and more.
Add sort criteria
You can sort your query in ascending or descending order, on one or more fields. You can also choose to sort randomly.
-
Click +Add Sort Criteria to add fields to sort on.
You can reorder the sort fields by clicking and dragging the handles to the right of each sort criteria.
For each set of sort criteria, select the following:
- Field - The field you want to sort on, from the fields included in the report
- Order - The order to sort in: ascending, descending, or random.
Save the report
Click Save at the top of the report page to save the report to the reports list. When you save the report, the report's configuration page appears, where you can schedule, share, modify the query, choose the report export options, and configure other options.
For more information on configuring report options, see Configuring report options.