Managing jobs
DM
When subscriptions run, Administrators and Data Managers can see the job outcome to identify any jobs that failed or completed with errors or warnings. If jobs fail, any failure notices are sent to the Administrator's inbox. From the job notification, you can navigate to the job details.
Supported subscriptions
-
Data Maintenance Subscriptions
-
Data Updater jobs
-
OpenData subscriptions
-
Source Subscriptions
-
Target Subscriptions
Job history
After a subscription runs, an overview of each job can be viewed from the Job History section at the bottom of the subscription configuration page.
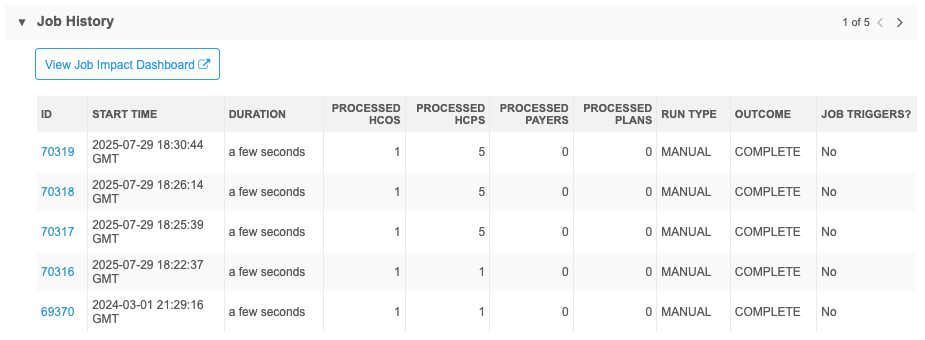
Use the Outcome column to identify jobs that completed with errors or warnings or that failed.
-
 Completed (green icon) - The job completed with no issues.
 -
 Completed (yellow icon) - The job completed with errors, warnings, or both.
 -
 Failed
(red icon) - The job did not complete.
Failed
(red icon) - The job did not complete.
Actions
-
View Job Impact Dashboard - Click the link to open the dashboard and view counts for the records that were added and changed by the subscription.
The dashboard will be filtered automatically to show updates made by the subscription for the past week.
For more information, see Job Impact Dashboard.
-
View job details - Each job is assigned an ID. Click the ID to open the Job Details page.
For detailed information, see Viewing source subscription job details.
Job status
To quickly check the job status of a subscription:
-
In the Admin console, click System Interfaces. The Systems page appears.
Data Updater jobs are available on the .
- In the left navigation, click the subscription type, for example, Source Subscriptions, Target Subscriptions, Data Maintenance Subscriptions.
The subscription page opens.
-
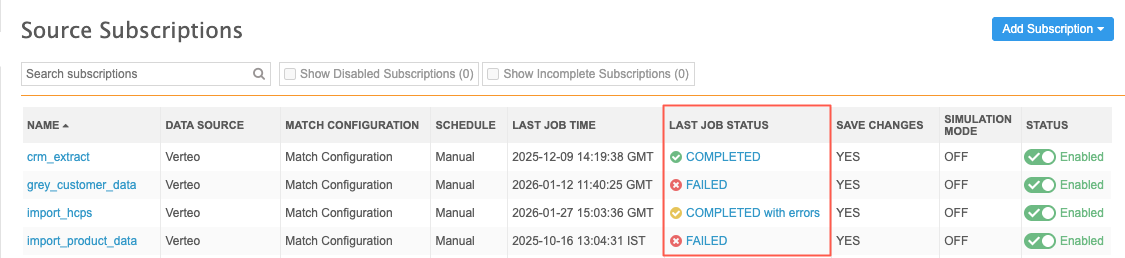
The Last Job Status column in the table identifies the following statuses for each subscription:
-
Completed
-
Completed with warnings
-
Completed with errors
-
Completed with errors and warnings
-
Failed
Example: Source subscriptions
-
- Click the status link to open the Job Details page.
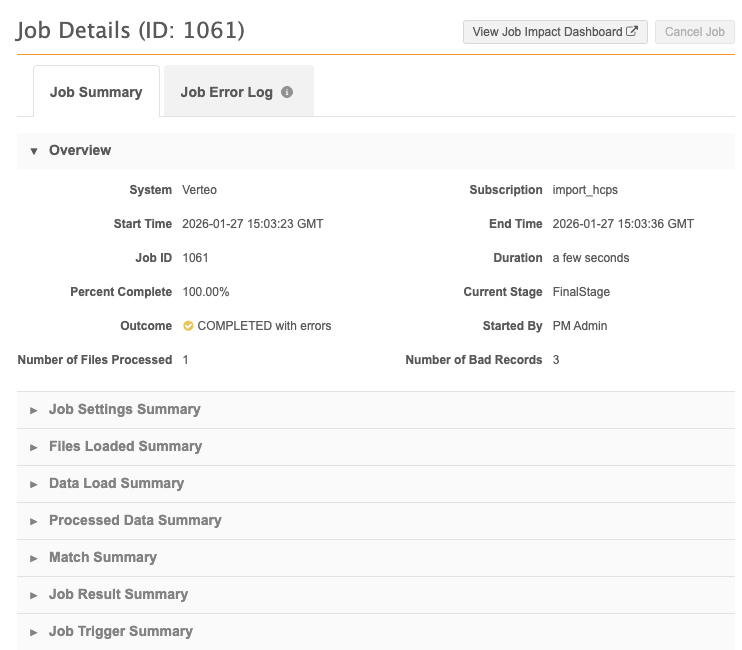
There are two tabs on the page:
Job Summary - Basic information about the job.
Job Error Log - Details about issues that occurred when the job ran.
Note: If the job ran before the Job Error Log was redesigned in Veeva Network MDM 25R3.1 (February 2026), the Job Error Log displays as a section on the Job Details page.
Job Summary
This tab displays information such as the name, ID, time, duration, FTP path, the user who started the job, and whether it was run manually.
It also provides details on the outcome, number of records processed and the number of bad records in the job.
Source subscription job details
-
For more information about source subscription job details, see Viewing source subscription job details.
-
For more information about target subscription job details, see Viewing job details
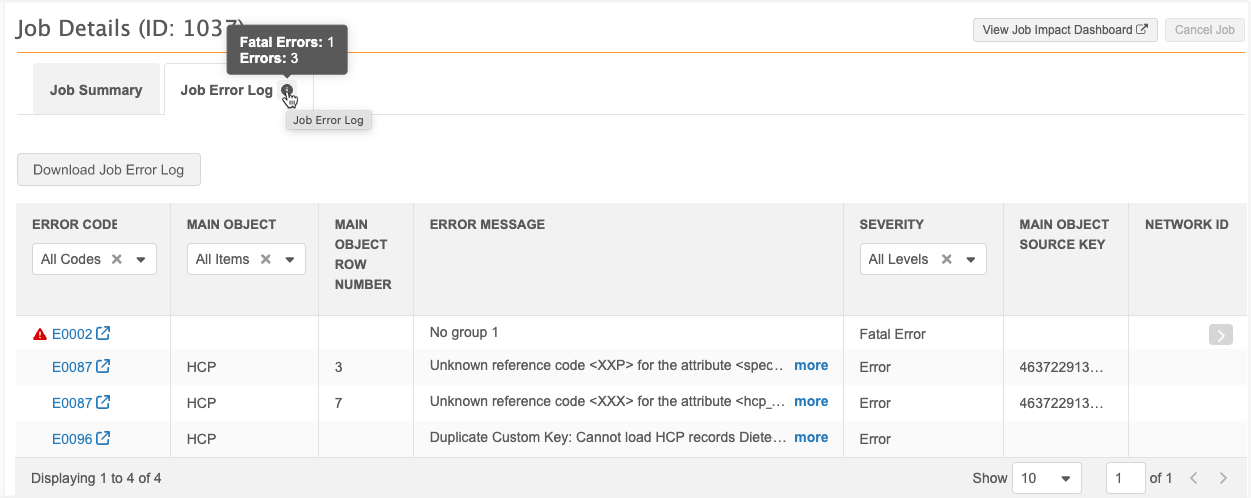
Job Error Log
The tab displays if the job completed with errors or warnings or the job failed.
On the tab, hover over the Info![]() icon on the tab to display a count for each error severity to give you a quick summary of the issues.
icon on the tab to display a count for each error severity to give you a quick summary of the issues.
Event details
Each job event is logged in the table with the following details:
| Column | Description |
|---|---|
| Error Code | A unique code assigned to common errors, warnings, and info messages.
Examples
The code displays as a link. Click the link to view the job error details. If an error code does not display, it is not a common error. Contact Veeva Support for assistance. If the error is not documented, the Info |
| Main Object | The HCP, HCO, or custom main object of the record with issues. |
| Main Object Row Number |
The row number in the main object’s source file (for example, HCP) where the issue originated. Note: This reference always refers to the main object's file, even if the actual error occurred within a related sub-object file (for example, Address). |
| Error Message | The reason the issue occurred. |
| Severity |
Identifies each job event as one of the following: Fatal Error, Error, Warning, or Information. Fatal errors are highlighted and pinned to the top of the list so you can quickly find the issue that failed the job. Tip: Filter on the severity to quickly find errors. |
| Main Object Source Key |
The identifier from the source file.
Hover over the identifier to display the Copy icon. Copy the ID so you can quickly find the issue in the source file. |
| Network ID |
The Network ID of the main object.
Populated only if the identifier is available. |
Download Job Error Log
Click the button to download the log as a .csv file.
Example source subscription log file
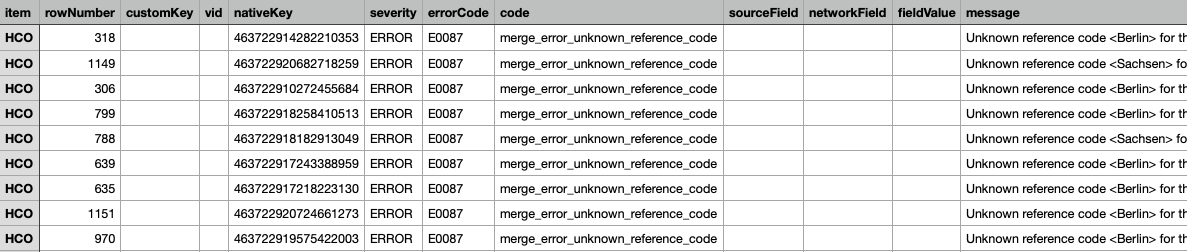
The Download Job Error Log button is always available.
Note: The Job Error Log option in subscription configurations saves the job error log as a .csv file in the logs root folder on your Network MDM FTP.
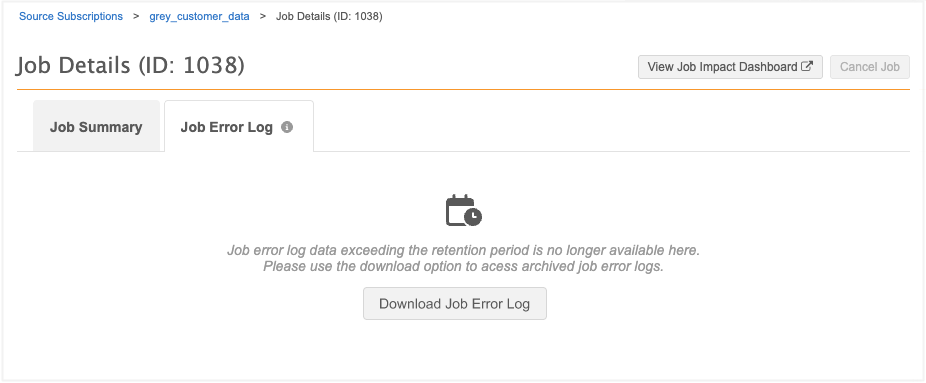
Error log retention
The details on the Job Error Log tab are available for at least six months.
If the time is exceeded, a message advises that the data is no longer available. Click Download Job Error Log to retrieve the archived error log.
The .csv file will be downloaded to your local computer.
Running jobs
You can access the Job Error Log tab while the job is running. It displays events as they occur. Refresh the page to view updated events.
This is helpful so you can cancel the job based on the interim results of the job.
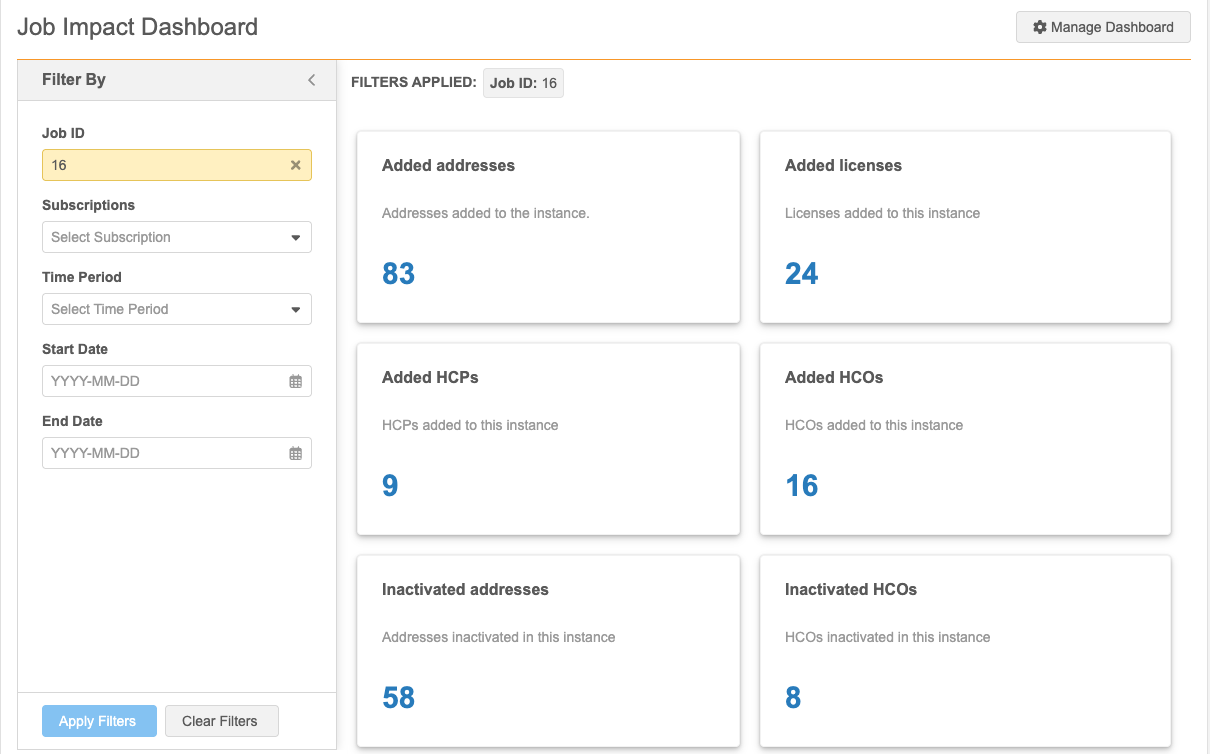
Job Impact Dashboard
Click View Job Impact Dashboard to open the dashboard and see how the job has added or changed records in your Network MDM instance.
By default, the dashboard is filtered for the Job ID on the Job Details page.