Integration Dashboard
DM
The Integration Dashboard provides an organized view of all the integrations coming in and out of Network MDM. Administrators can use the dashboard to track integration activities by system from a single location.
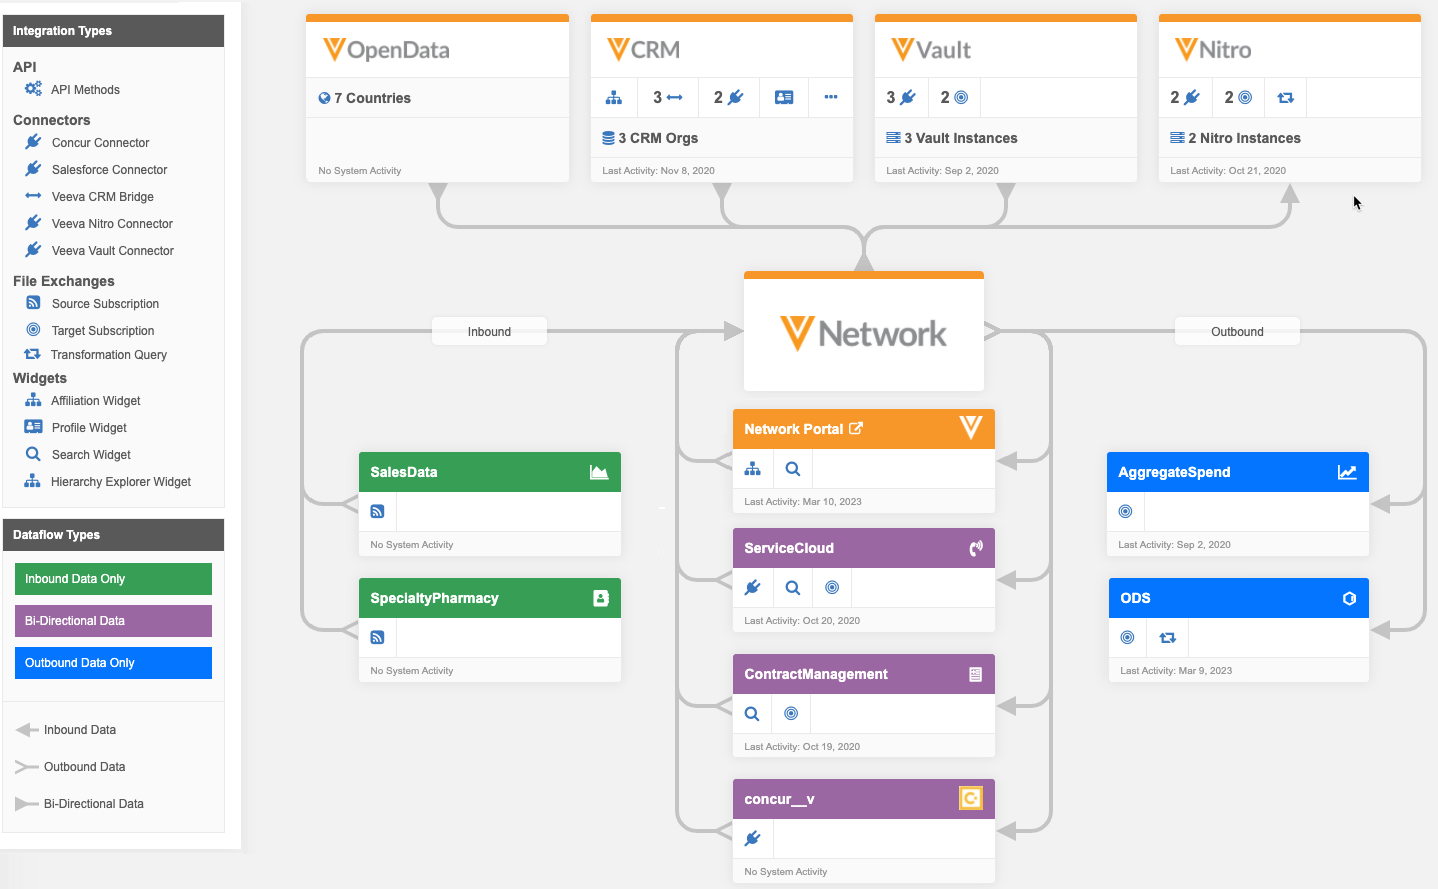
The Integration Dashboard is enabled by default.
Access the dashboard
To open the dashboard, on the Admin console, click Integrations.
Dashboard
All systems integrated with your Network MDM instance are represented on the dashboard. Veeva systems are located at the top of the dashboard.
Other systems that you have defined in your Network MDM instance are added by default and are grouped by the dataflow directions:
- Inbound - The system only has inbound integrations.
- Outbound - The system only has outbound integrations.
- Bidirectional - The system has bi-directional integrations or has both an inbound and an outbound integration.
Each dataflow group is sorted so that the systems that are most frequently used are at the top of the list.
Viewing system cards
Each system has a card that provides the following information:
- System Name - The name that you defined when you created the system (System Interfaces > Systems).
- Icon - A Veeva icon for Veeva systems, or a predefined icon for non-Veeva systems.
- Type - The Veeva product name or Other for non-Veeva systems. The Type is defined when you create the system.
- Dataflow Type - Inbound, Bidirectional, or Outbound.
-
Integrations - Data integrations represented by icons, for example, target subscriptions or source subscriptions. See the Integration Types legend for details.
Systems with multiple integrations of one type have a count beside the icon; for example, 2
 means that there are two target subscriptions configured for the system. Only active integrations display on the dashboard; for example, disabled target subscriptions do not display.
 - Last Activity - The date that the most recent integration ran. No System Activity message means that the integration has yet been run.
View Veeva system cards
Veeva cards display for each product that you integrate with. Cards for CRM, Vault, and Nitro are similar.
Example
The Veeva CRM card displays all CRM systems (orgs) in your Network MDM instance. If the card does not have room to display all the integrations, click the ellipses (....) to expand the integrations.
The count beside each integration is a total for all CRM systems in your Network MDMinstance. For example, if you have two CRM orgs and two target subscriptions, that could mean that each org has one target subscription.
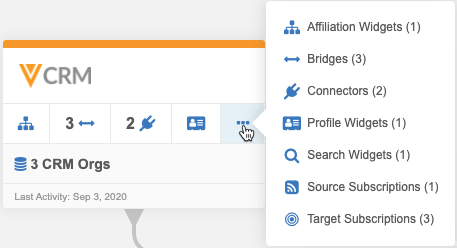
Click the card to open it.
Example
In this example, the Network MDM instance has three CRM orgs defined. The system that displays by default is first alphabetically by name.
The integrations for the system display in the left panel. Use the System list to switch to the other CRM system.
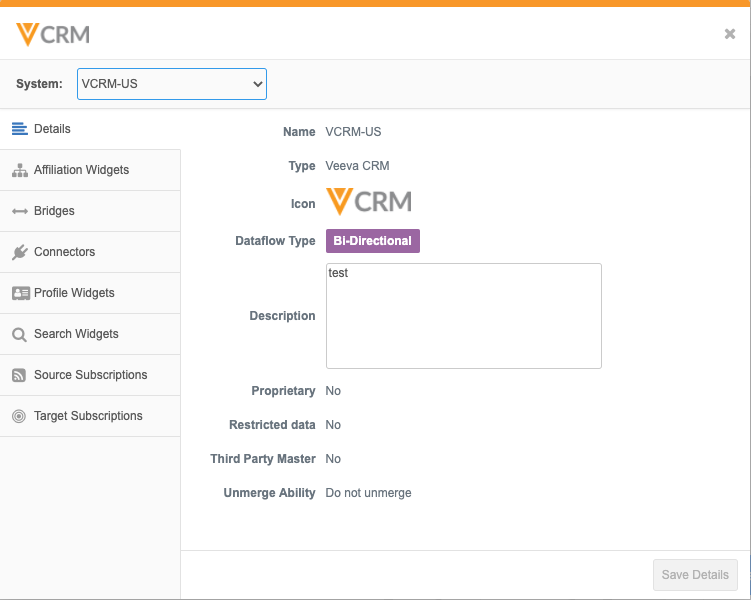
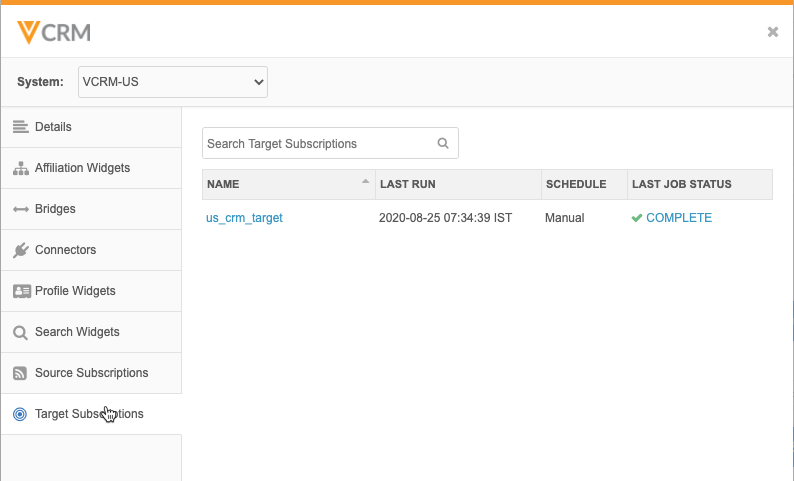
Click on an integration to view more details. For example, click Target Subscriptions to see details about the subscription jobs. The time of the last job displays in your timezone. Click the link in the Name column to navigate to that subscription configuration.
Veeva OpenData system card
If you subscribe to OpenData, the card displays the count of countries that you have subscribed to.
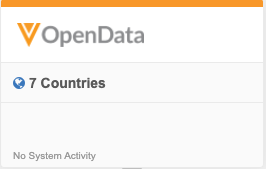
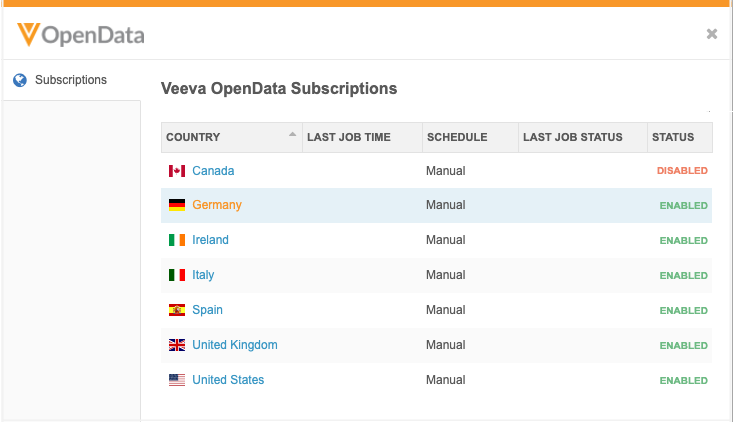
Click the card to view the list of countries. Each country subscription displays the subscription status and details about the most recent jobs. Click the country link to navigation to the subscription configuration.
Add and edit custom systems
When you create a new system in your Network MDM instance (System Interfaces > Systems) the system will automatically display on your Integration Dashboard once an active integration is created; for example, after a target subscription is created for the system. The system can be edited to change the icon and description. The system properties (for example, Proprietary and Unmerge Ability) are read-only on the Integration Dashboard.
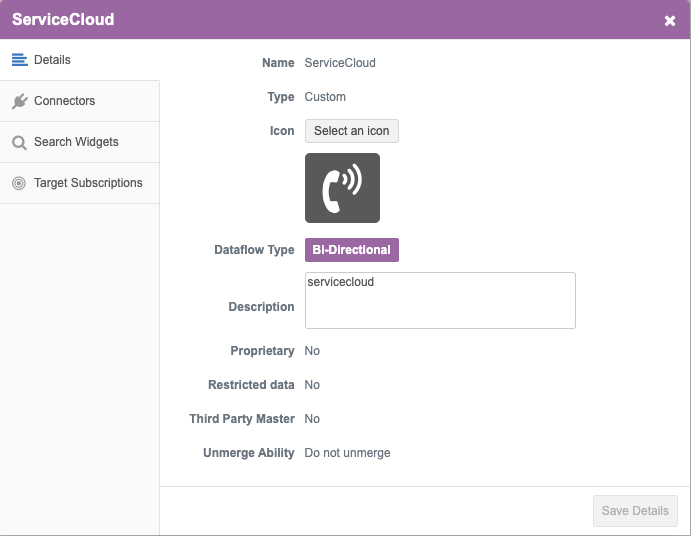
Veeva and SAP Concur system cards are read-only.