Report on record level Network Bridge errors
DM
Administrators can report on record level errors in Network Bridge jobs. You can query the data and error types for each Bridge job in the SQL Query Editor.
Reporting on jobs with issues
Job triggers can notify you when jobs fail, but they don't notify you about completed jobs that have errors.
Sample query
Use the Bridge Jobs with Issues sample query to report on Network Bridge jobs that have failed or completed in the last day with record level errors. You can use this query as it is or customize it to get more granular record type errors.
Tip: Save the query as a saved report so you can schedule it to run and to be notified when there are errors.
The data from Network Bridge jobs is available in Network Reports almost immediately after the job has run.
To use this query:
-
On the Network menu, click Reports > SQL Query Editor.
-
In the query box, click the Sample Queries button.
-
Use the search bar to find the Bridge Jobs with Issues query.
-
Select the query and click Preview Query to review it.
-
To use the query, click Insert Selected Query.
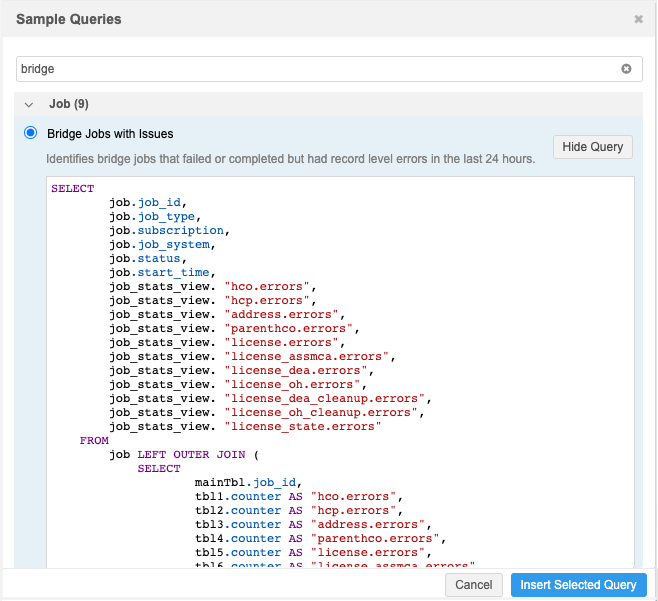
The query will be added to the SQL query box. A green checkmark displays at the bottom to indicate that the query is valid.
-
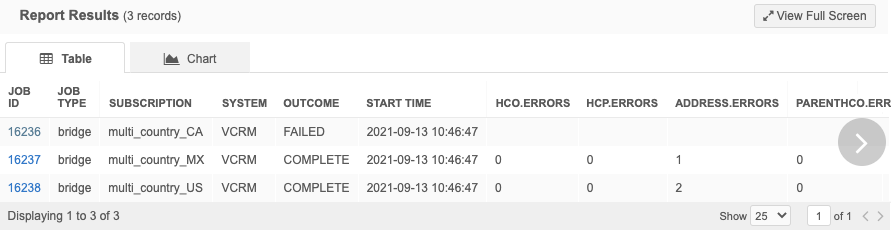
Click Run Query. The results display below the query box.
Any Network Bridge jobs that ran in the last 24 hours and failed or completed with record level errors will display.
Notifications for record level errors
Save the query so the report can be scheduled to run after a Network Bridge job. You can also choose to receive an email notification when report results are created.
Example
Save the Bridge Jobs with Issues sample query and schedule it to run daily after your Network Bridge job runs so you can be notified if record level errors occur.
Save the report:
-
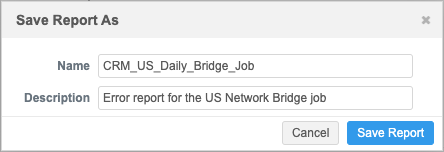
In the SQL Query Editor, insert the query into the query box and click Save Query.
-
On the Save Report As dialog, type a Name and Description. Click Save Report.
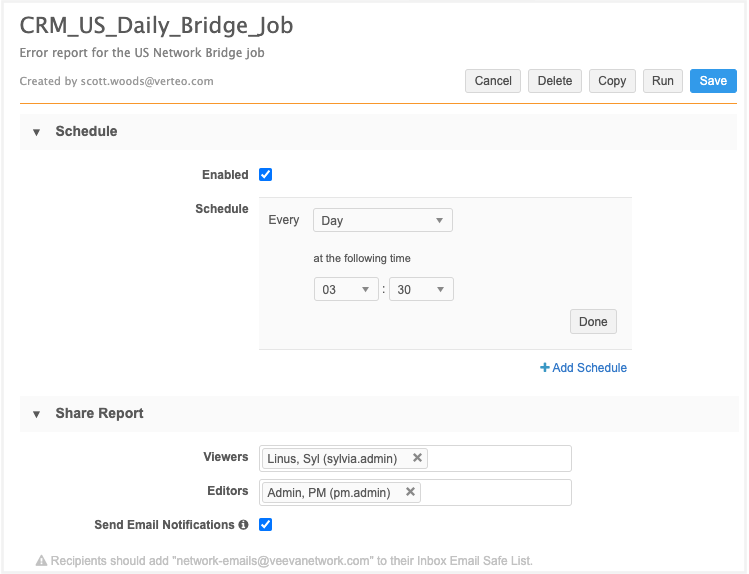
The saved report configuration page displays.
-
Schedule section - Click Enabled and choose the schedule.
For example, if your Network Bridge job runs daily, schedule the report to run every day at a specific time (for example, 30 minutes after the Bridge job typically completes).
-
Share Report section - Add users to the Viewers and Editors fields. These users will have access to view or edit the report.
-
Click Send Email Notification so the users will be notified when the report has run.
The report details will not be included in the email notification. Users must log into Network to view the details.
Note: The Bridge Job with Issues query is configured to have results only if the Bridge job has failed or completed with record level errors in the past 24 hours. If there are no results, the email notification is not sent.
-
Continue configuring the saved report to specify your download preferences and click Save.
This report will now run every day. If a Network Bridge job completes or fails with errors, an email notification will be sent to the specified users.
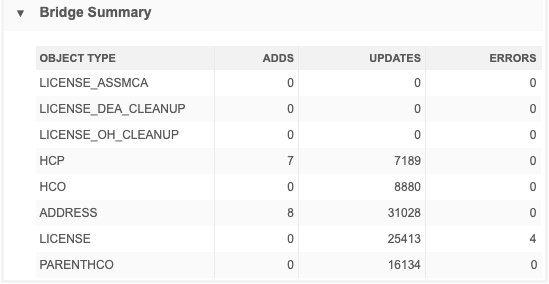
Network Bridge stats
If you want to create your own query, the data from the Bridge Summary section on the Job Details page is available to report on in the SQL Query Editor.
To query on the job stats:
-
In the tree view in the SQL Query Editor (Reports), click the Data Loading & Matching section.
-
Expand the Job Stats Summary section. The job stats are listed in alphabetical order. Highlight the job stat and click the Add to Query icon to move the column into the query box.
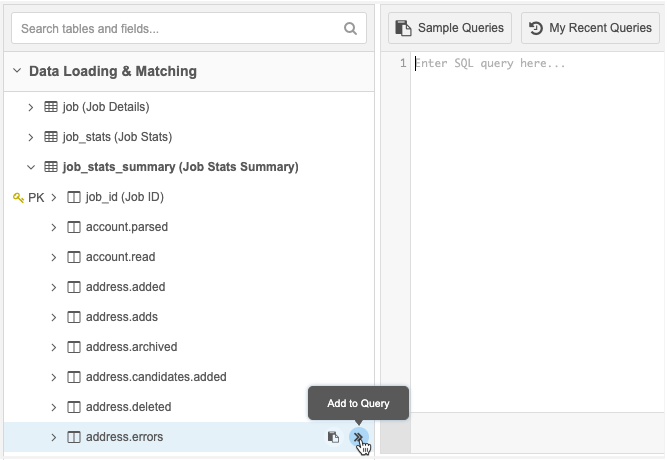
For more information about creating queries, see Building reports with SQL queries.
Job stats by object
The following metrics are available for each object in the Job Stats Summary reporting table.
| HCP | HCO | Address | License | Parent HCO |
|---|---|---|---|---|
|
hcp.adds hcp.updates hcp.errors |
hco.adds hco.updates hco.errors |
address.adds address.updates address.errors |
license.adds license.updates license.errors license_assmca.adds license_assmca.updates license_assmca.errors license_dea_cleanup.adds license_dea_cleanup.updates license_dea_cleanup.errors license_oh_cleanup.adds license_oh_cleanup.updates license_oh_cleanup.errors |
parenthco.adds parenthco.updates parenthaco.errors |
Additionally, there are two error type metrics that can be used:
-
errortype.unable_to_delete_address
-
errortype.salesforce_upsert_error
Error category stats
You can also use the following error type metrics to query the error category statistics for each Network Bridge Job. For example, you might want to know only when APEX or locking errors occur.
-
errortype.locking_error
-
errortype.mapping_error
-
errortype.salesforce_upsert_error
-
errortype.system_limit_exception_apex_limit_error
-
errortype.system_limit_exception_too_many_query_rows_error
-
errortype.trigger_flow_error
-
errortype.unexpected_error_while_processing_bulk-api
Use these metrics to report on more granular record type errors.