View Network reporting logs
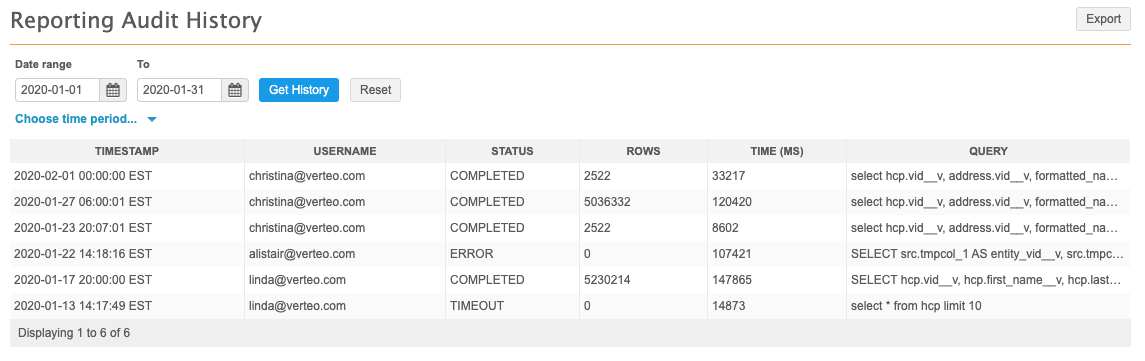
The Report Audit History displays all SQL queries run by each user. The query list includes the user name, status, processed rows, and query code run.
By default, up to 50 entries for the past day display.
Access the log
Administrators can access the Report Audit History page by clicking Logs > Report Audit History.
Event details
Each event includes the following information:
- Timestamp - the date stamp for the query event.
- User Name - the initiator of the event.
- Status - the role of the user that initiated the event.
 Possible values
COMPLETED: the query completed successfully.TIMEOUT: the query took too long and timed out.ERROR: the query contained an error. - Rows - the number of rows returned by the query.
- Time - the time taken to run the query in milliseconds.
- Query - the query run. Hover over a cell to see the full text of the query.
The possible values listed here include the most common values for each column. If you don't see the definition for a value that appears in an audit history log in your instance, let us know.
Filter by date
To view results for a specific time period, perform one of the following actions:
-
Date range - Define a date in the Date range and To fields.
-
Time period - Expand the time period list and select a predefined period, for example, Last 7 days.
The Last day option can display up to two days of results, including the data from the previous day through to the current time.
Click the Get History button to view the results.
Export the audit history
To download the refined audit history to your local file system, click Export.
The log is downloaded as a .csv file that you can open using a spreadsheet application.